


Mastering Probability Daily Edition as of 9:24 a.m. for April 30, 2025
Mastering Probability Market Position:

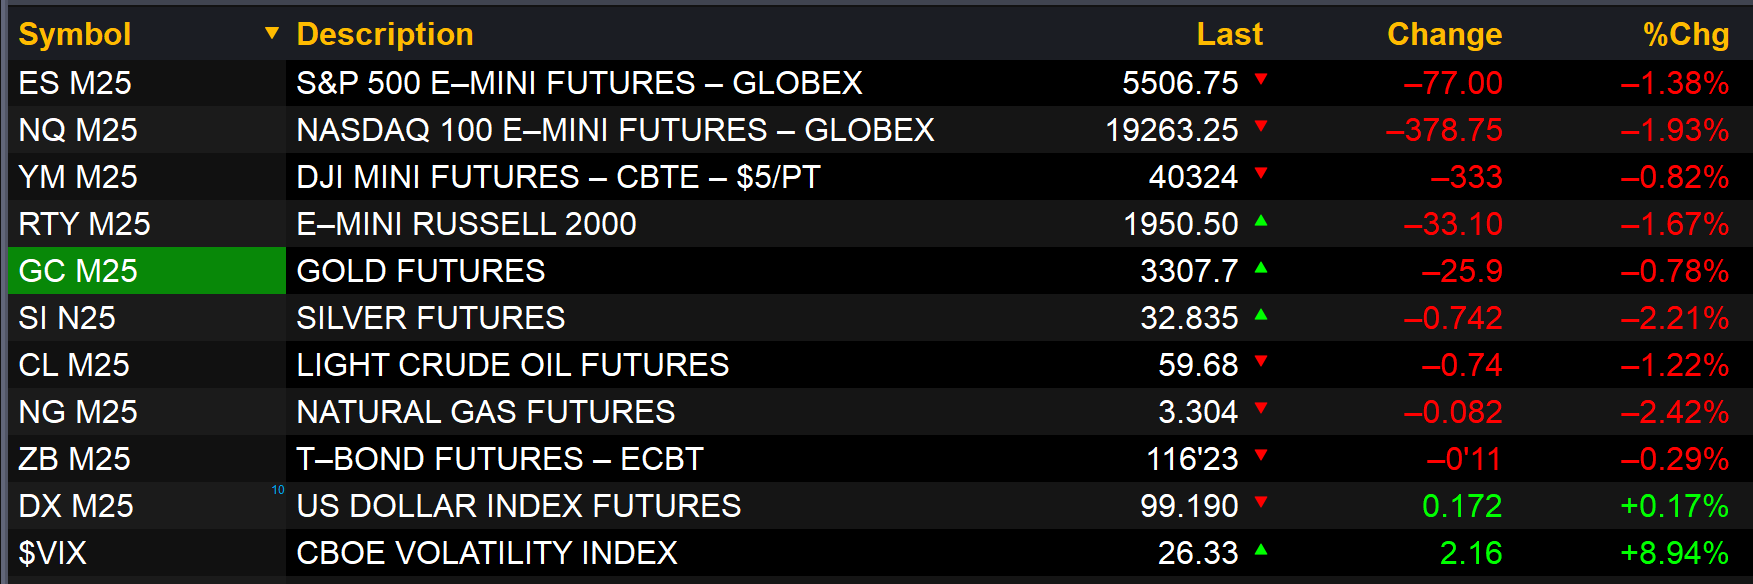
As of 9:06 a.m., U.S. equity and metal futures are trading lower with a U.S. dollar index that is trading higher.

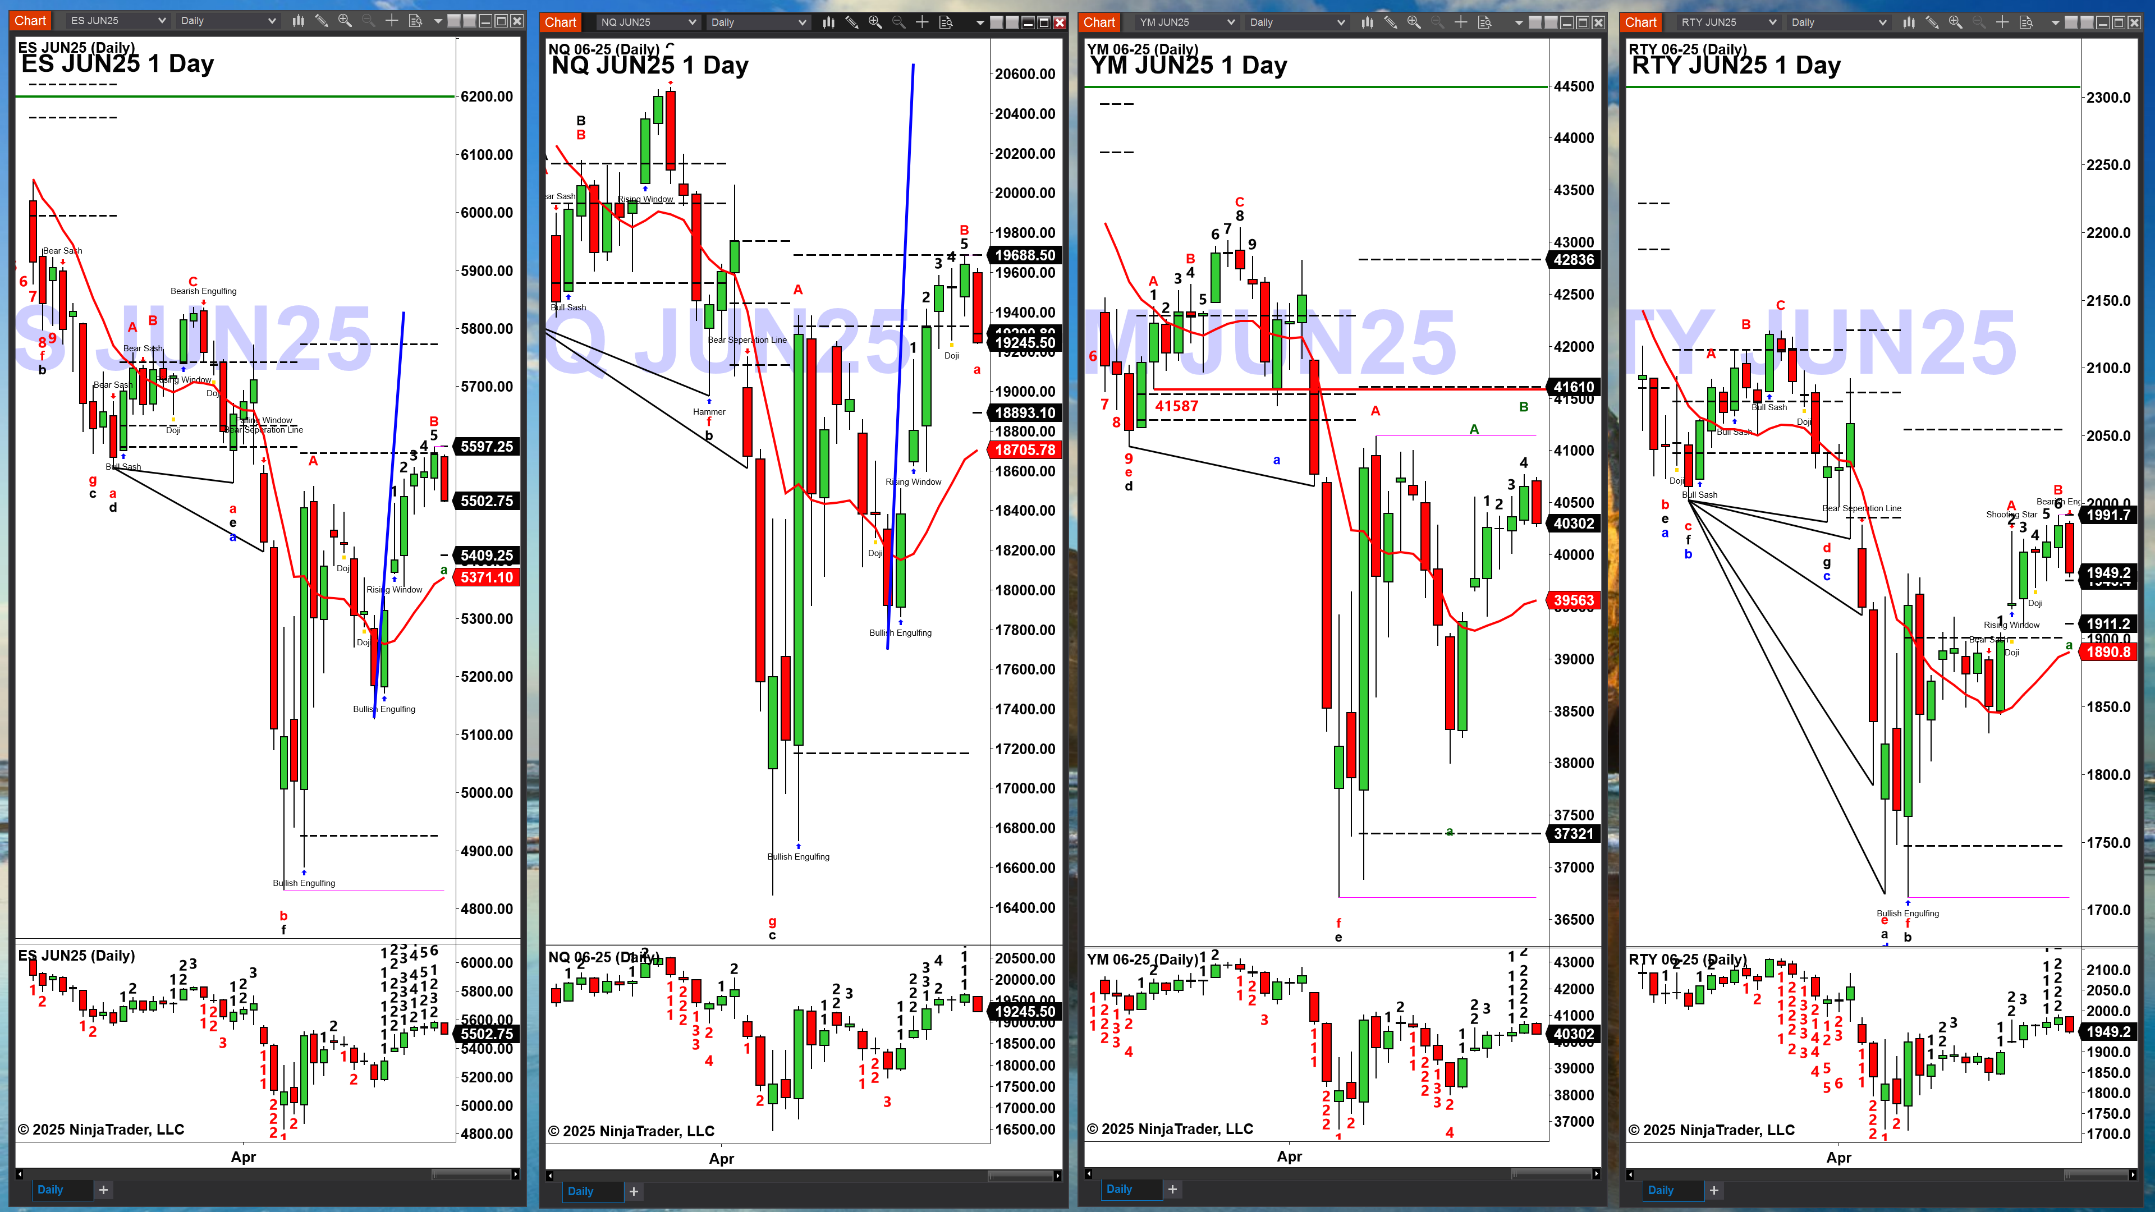
New daily profiles are attempting to form for the ES, NQ and RTY with the bottom of those profiles being a potential downside target, 5409, 18893 & 1911.20 respectively. The YM’s price target would be its OUL unless a new profile forms.
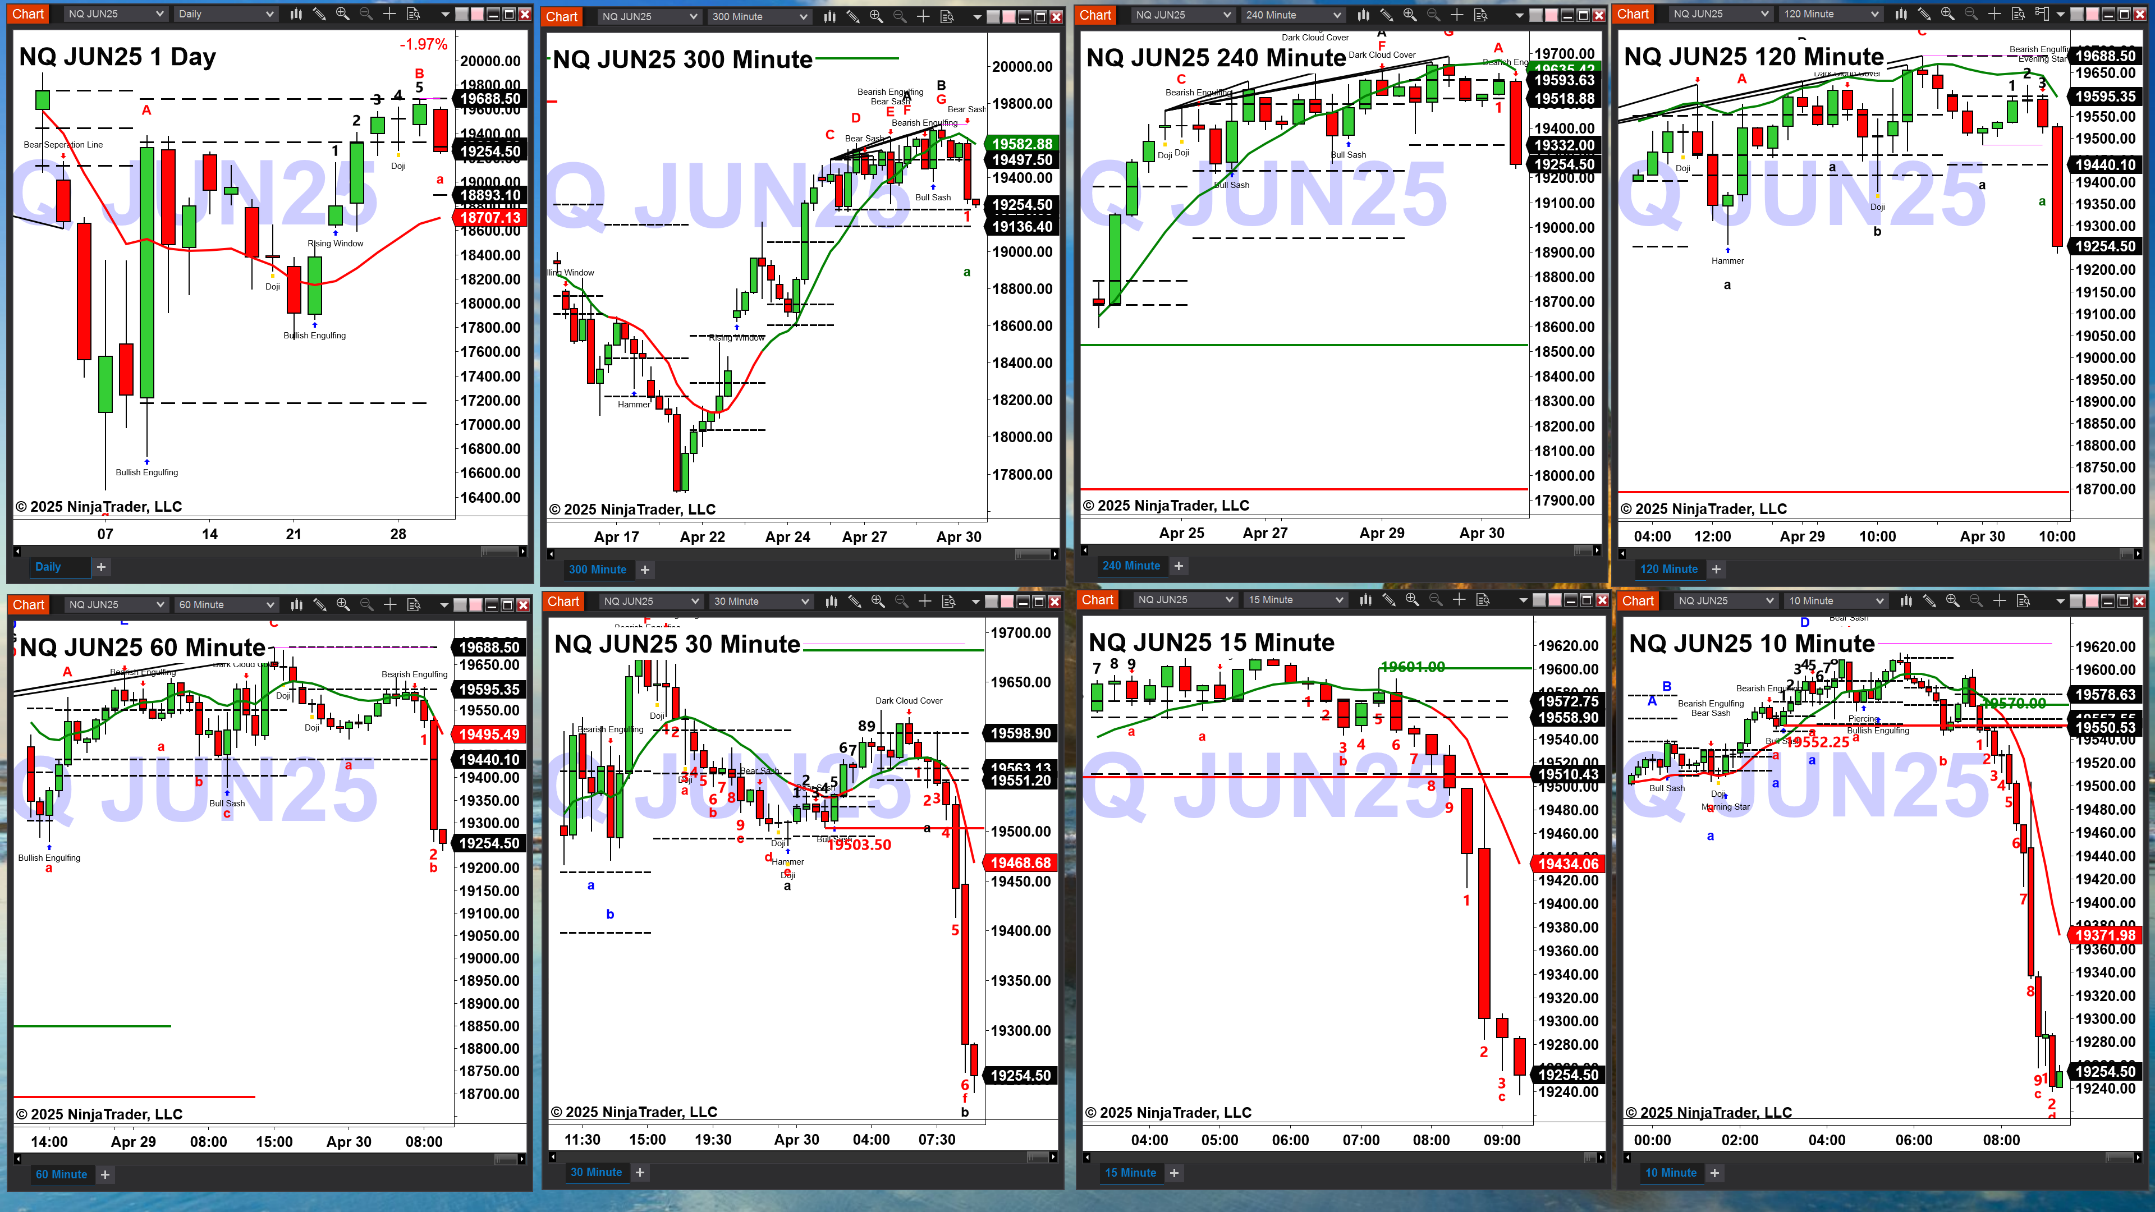
Another potential support level for the NQ would be its 5-hour buy zone, 19136 – 19226.
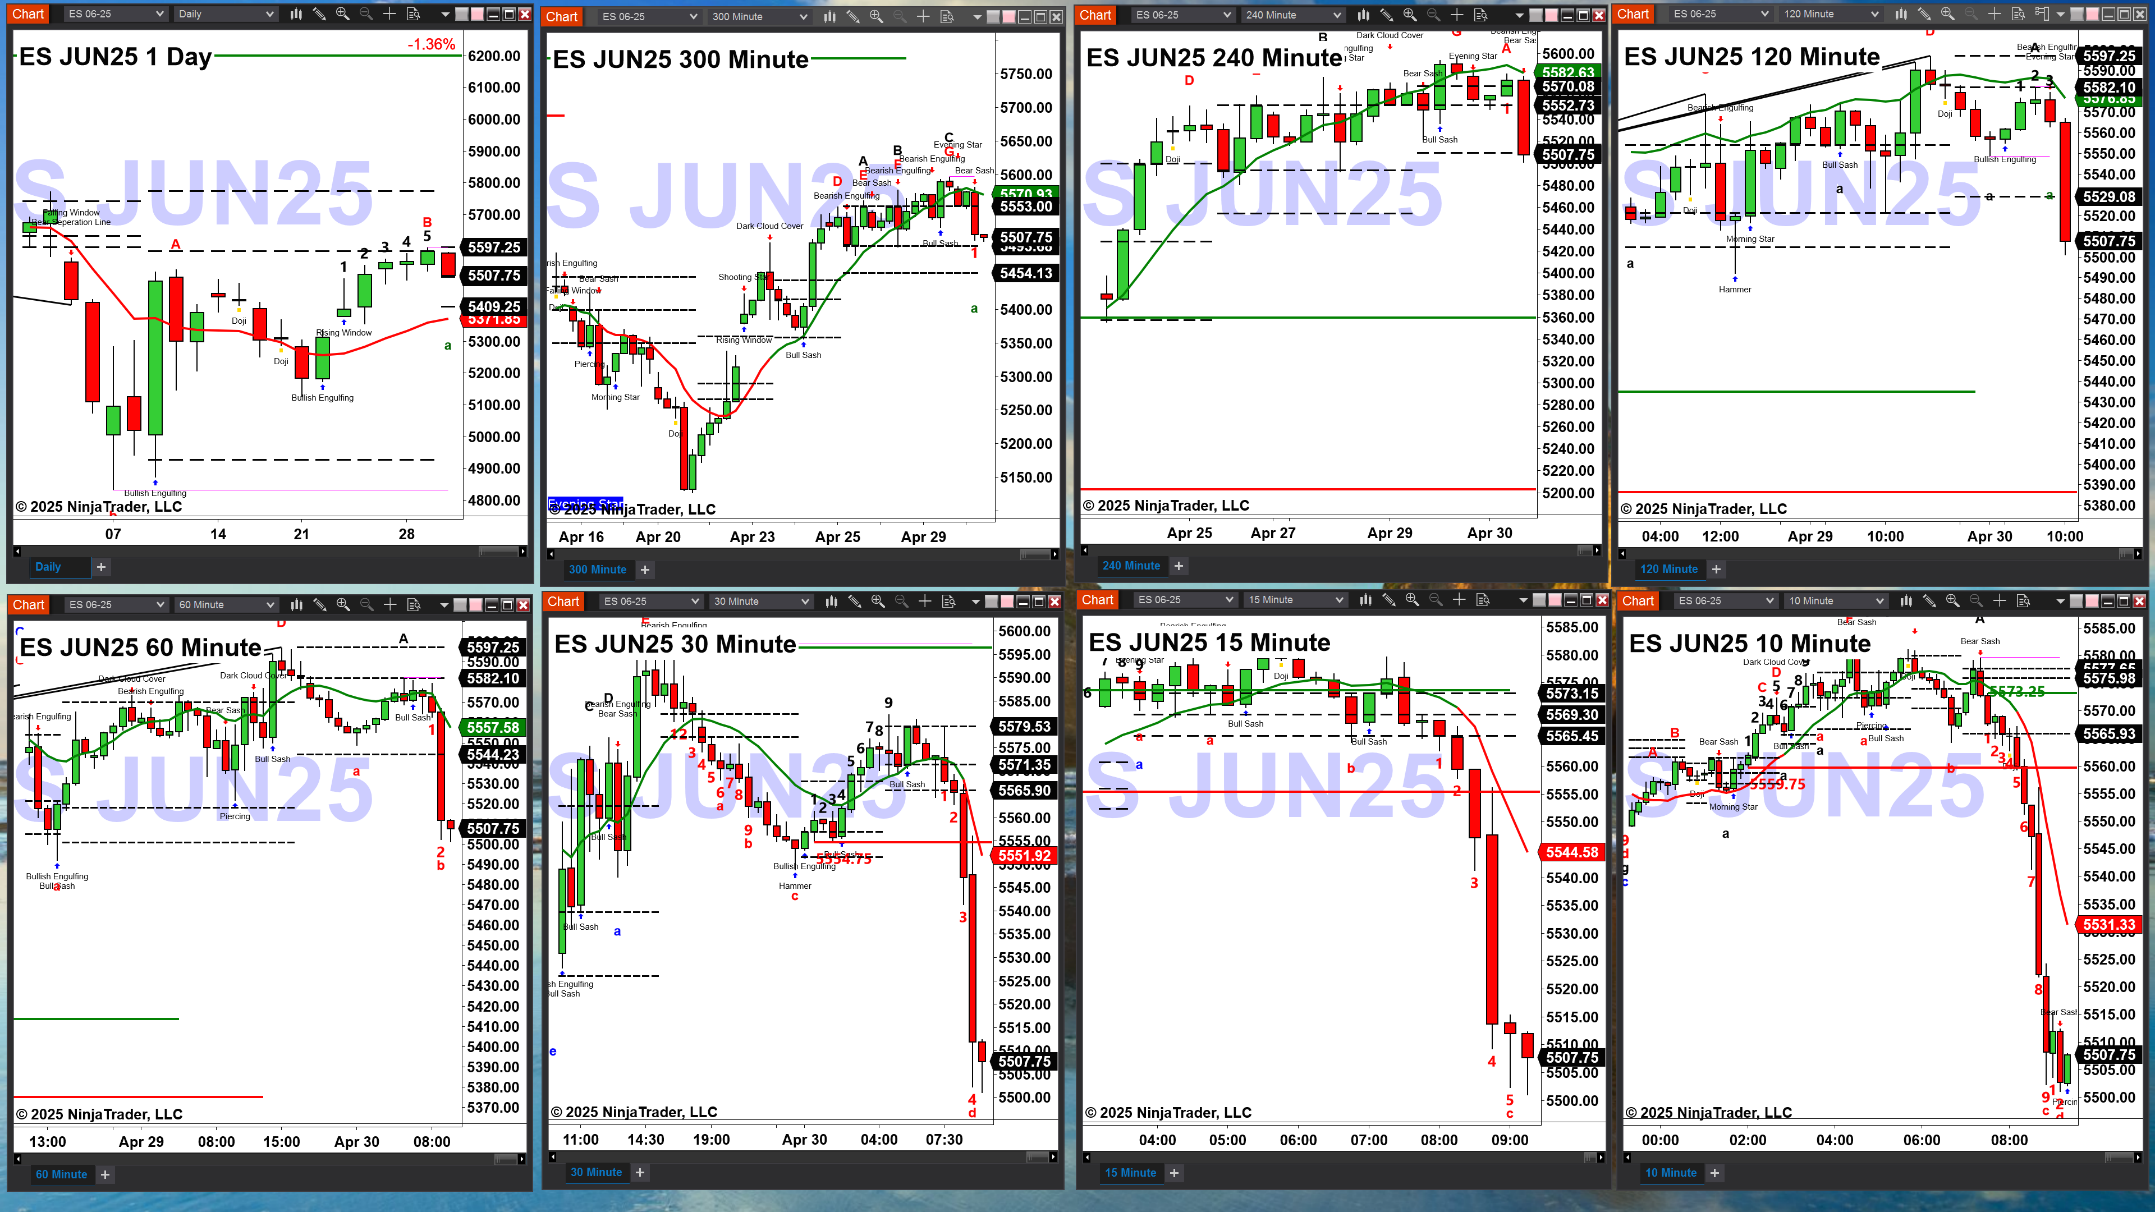
Another potential support level for the ES would be its 5-hour buy zone, 5454 – 5493.
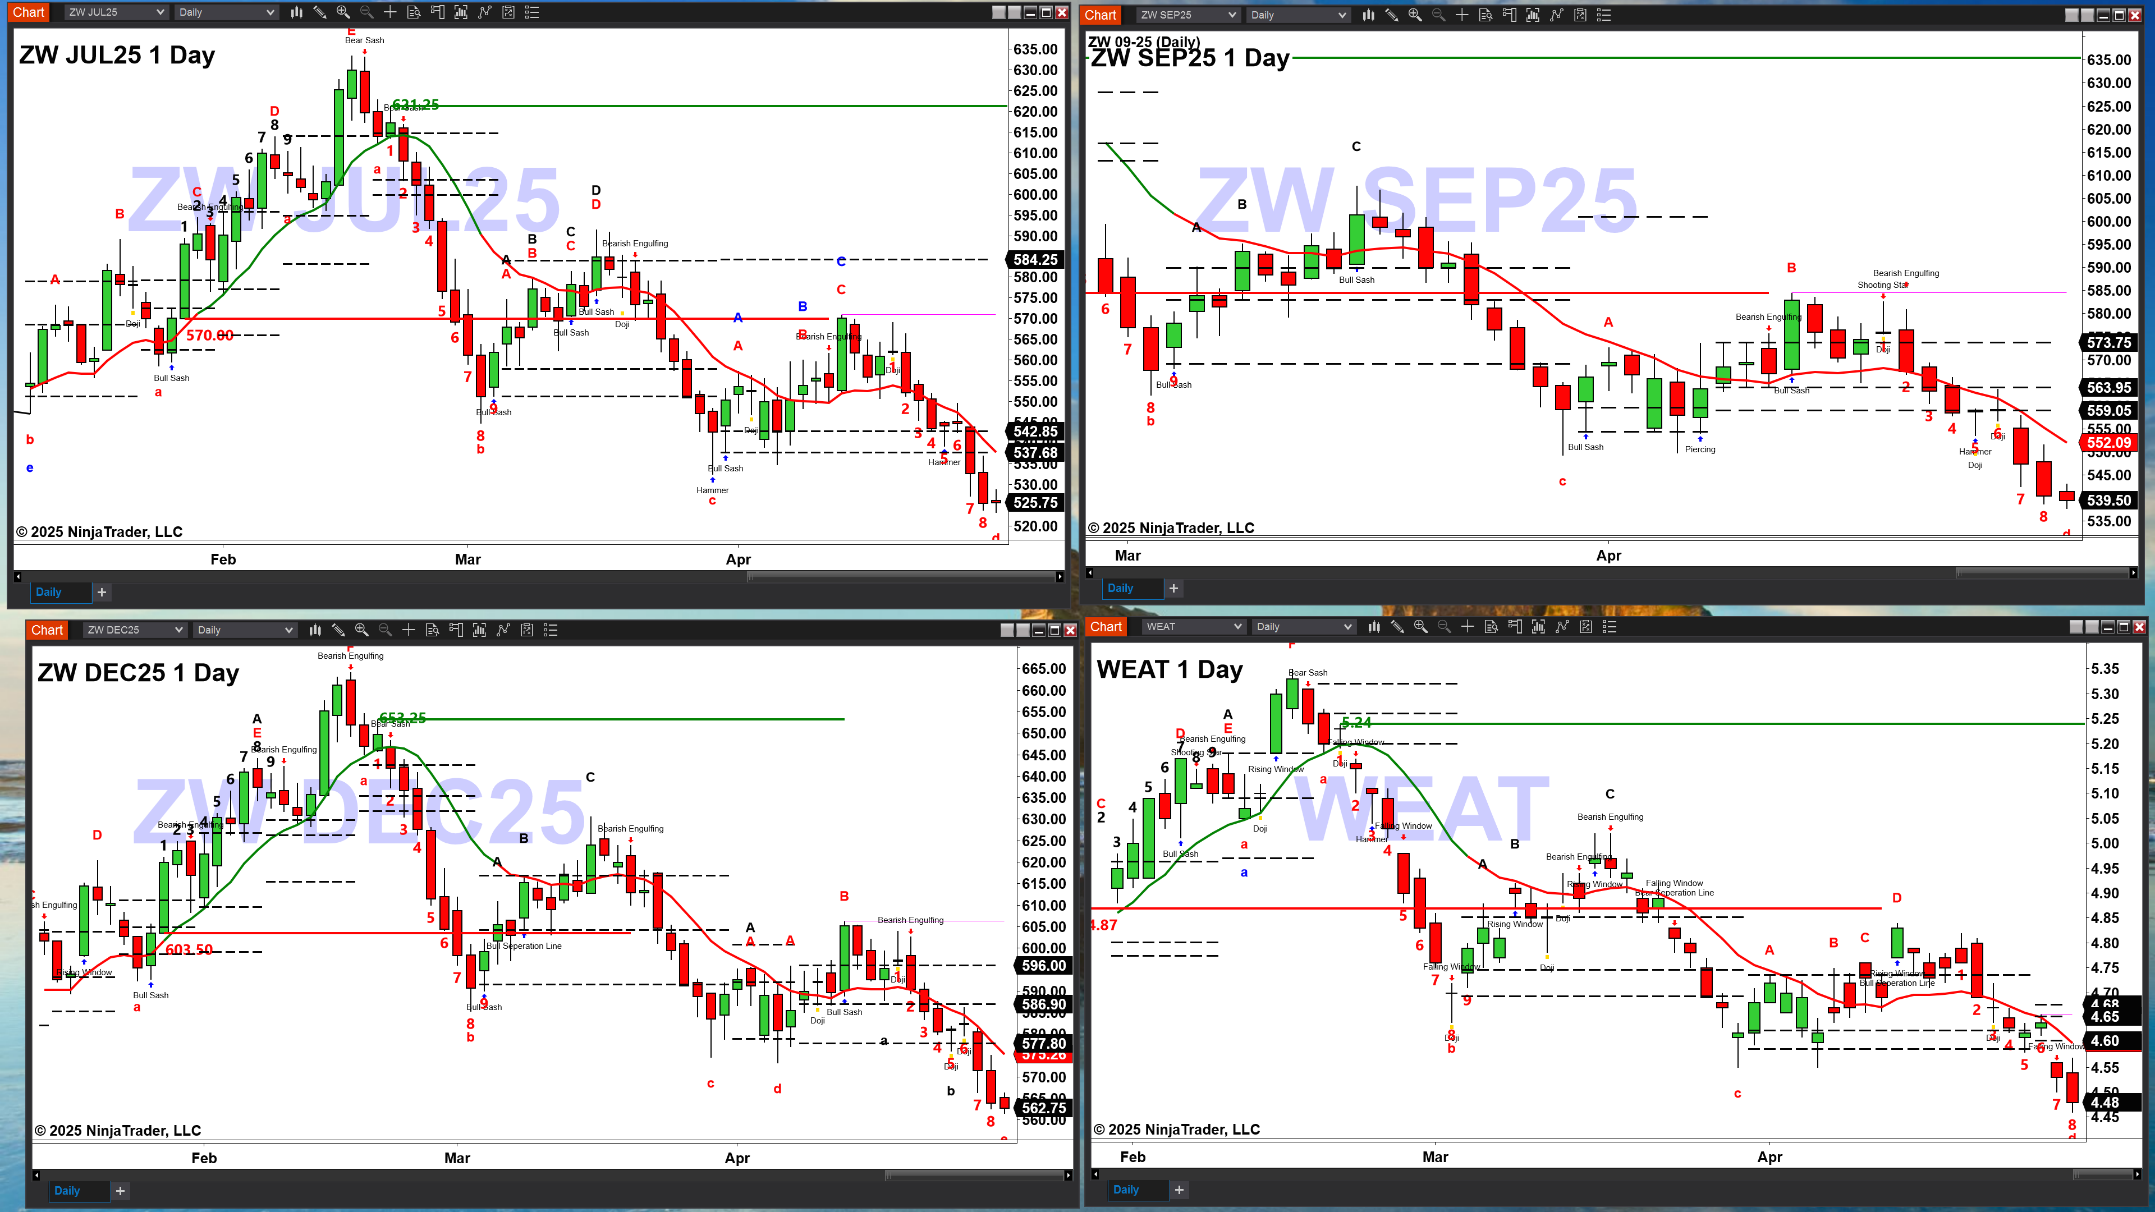
Another upcoming potential trade is in WEAT. The daily futures contracts that make up the WEAT ETF will form TD9 bottom patterns today and will complete this pattern tomorrow.
Position:
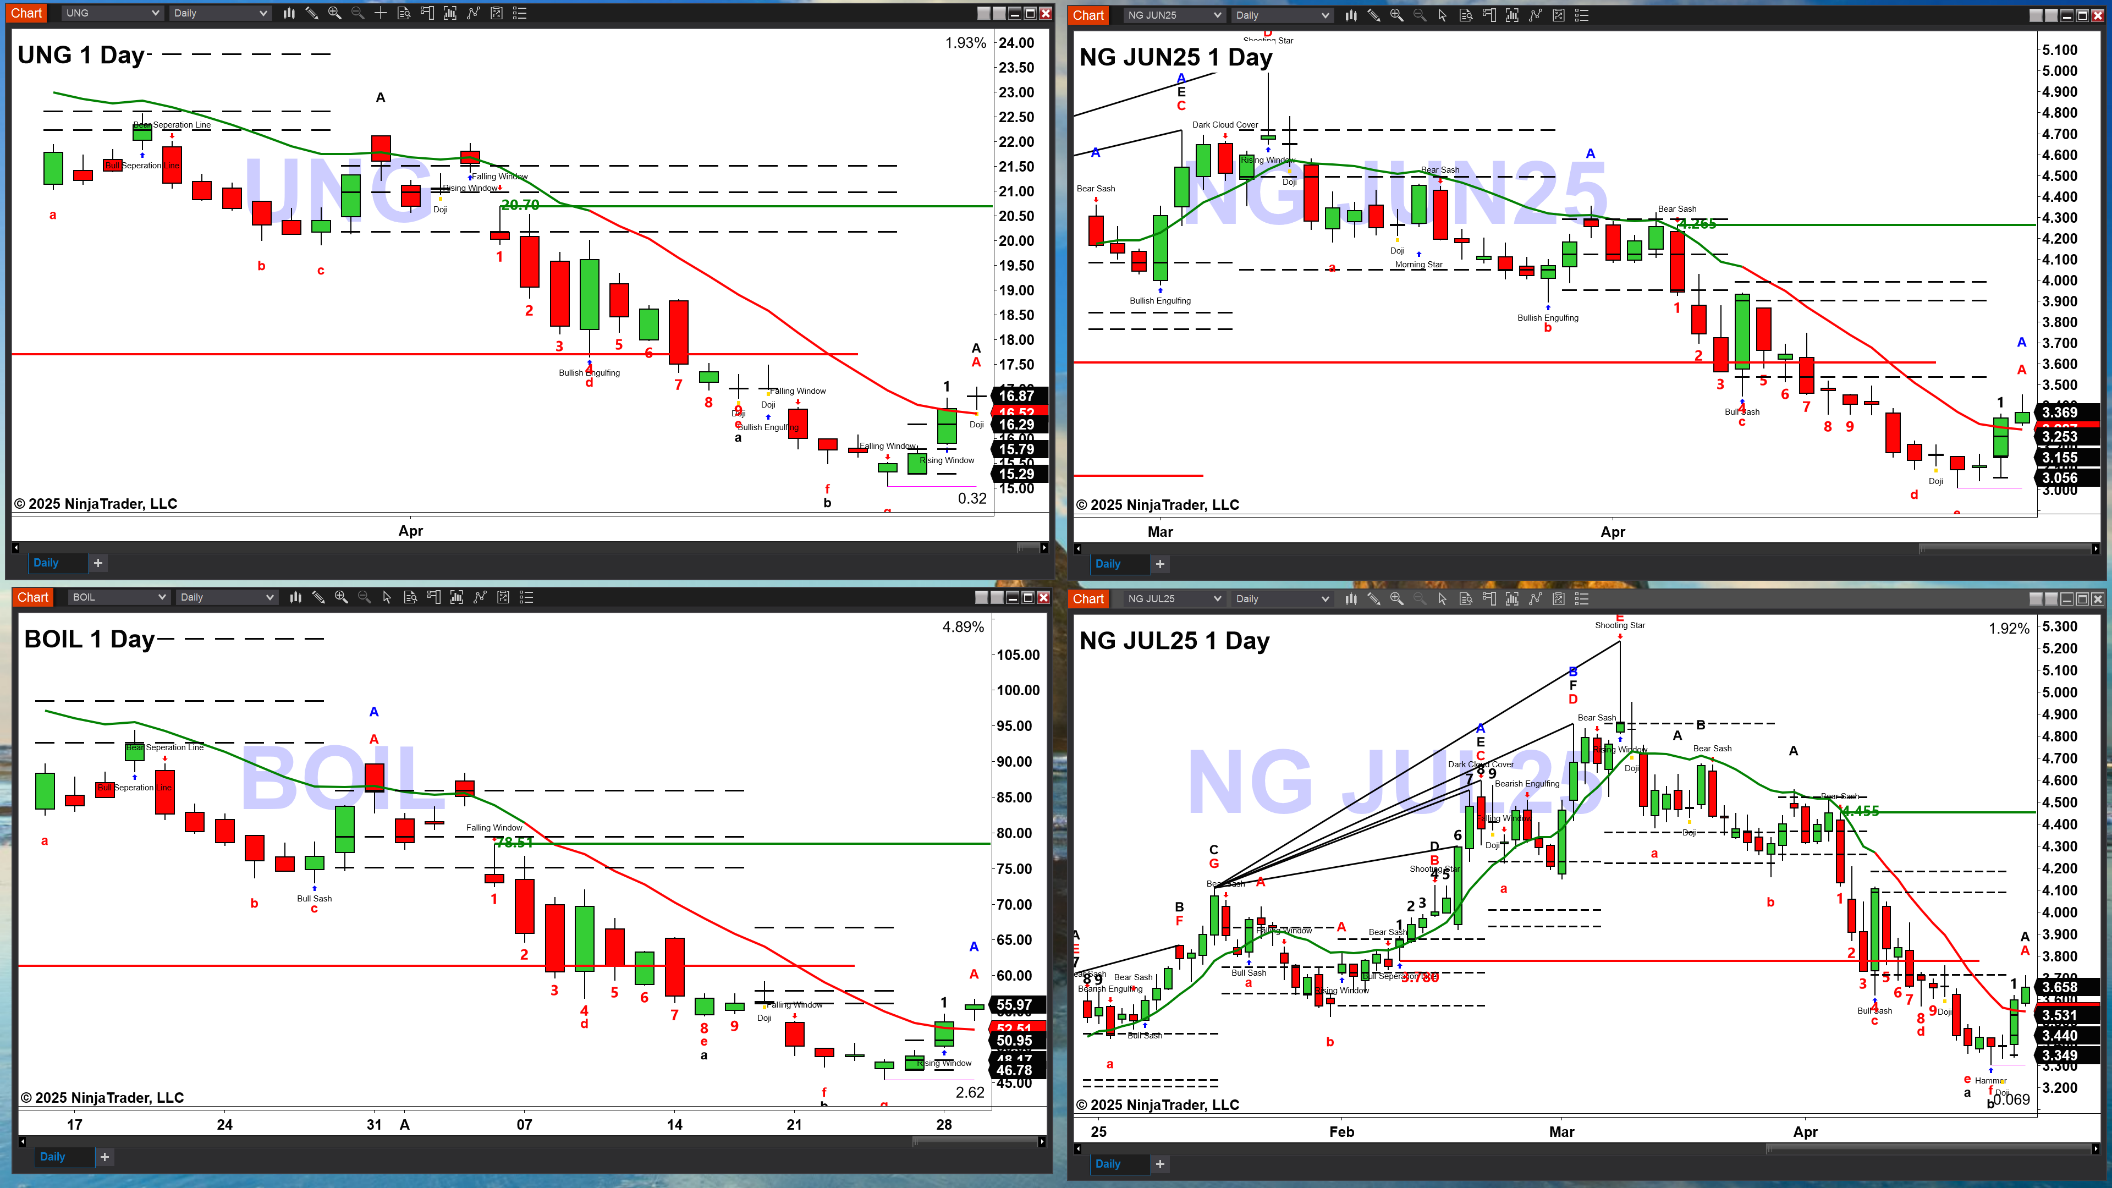

We began a long trade in Natural Gas via either UNG or BOIL because of the futures contracts affiliated with their respective ETF’s close above OUL and profile which should lead to a rally towards their TD9 breakdown levels (solid green line).
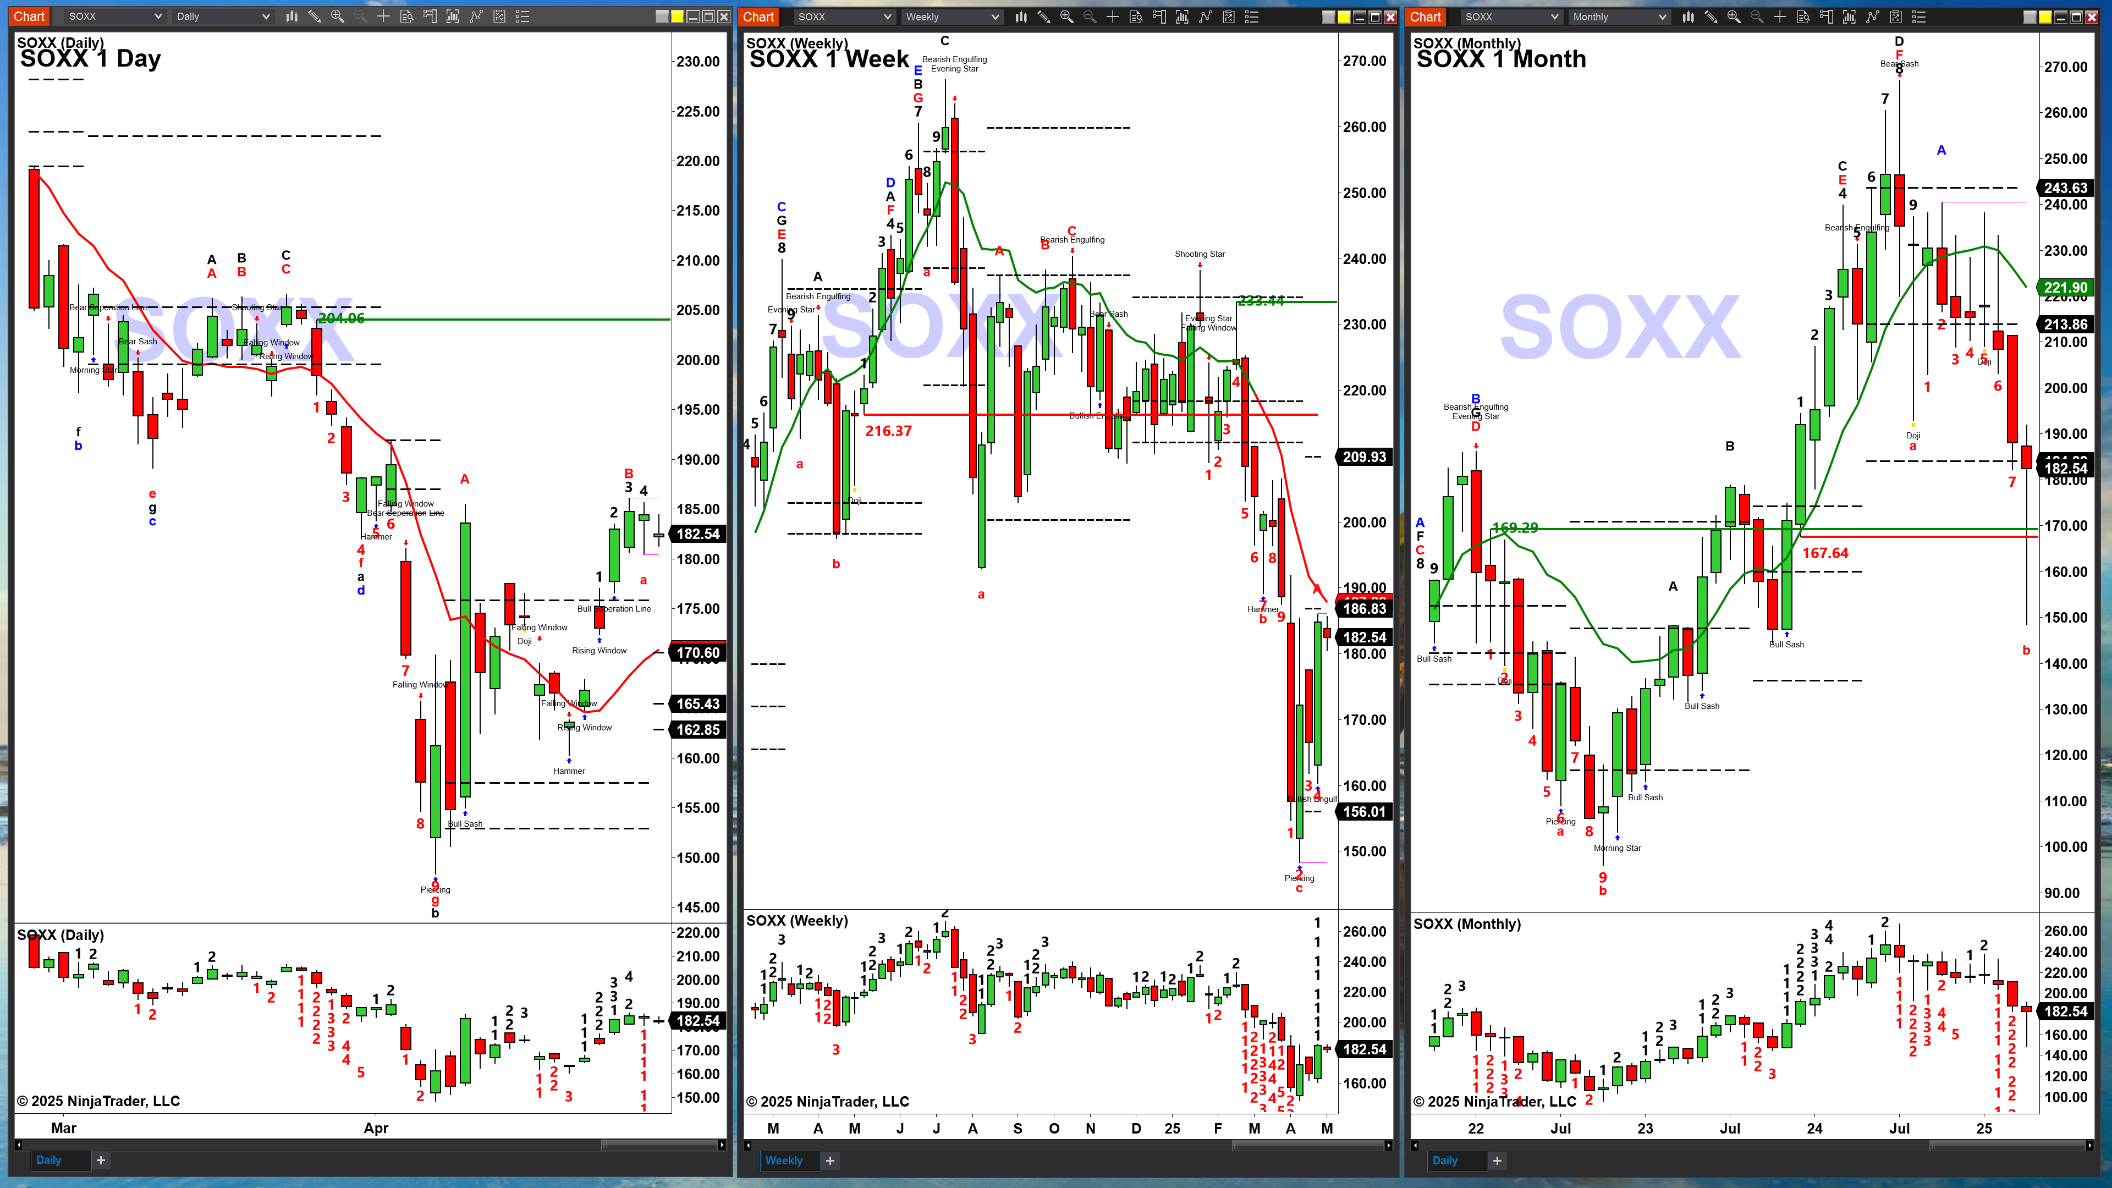
We are long the XOSS because of its daily TD9 bottom, its weekly Gartley Buy pattern and the monthly chart which tested and rejected its TD9 breakout area and may form a TD9 bottom between April and June of this year.
After a 4-day consecutive rally, we were anticipating a 2-day move lower. Today was basically a sideways move.
Quick guide for daily support and resistance levels for popular instruments:
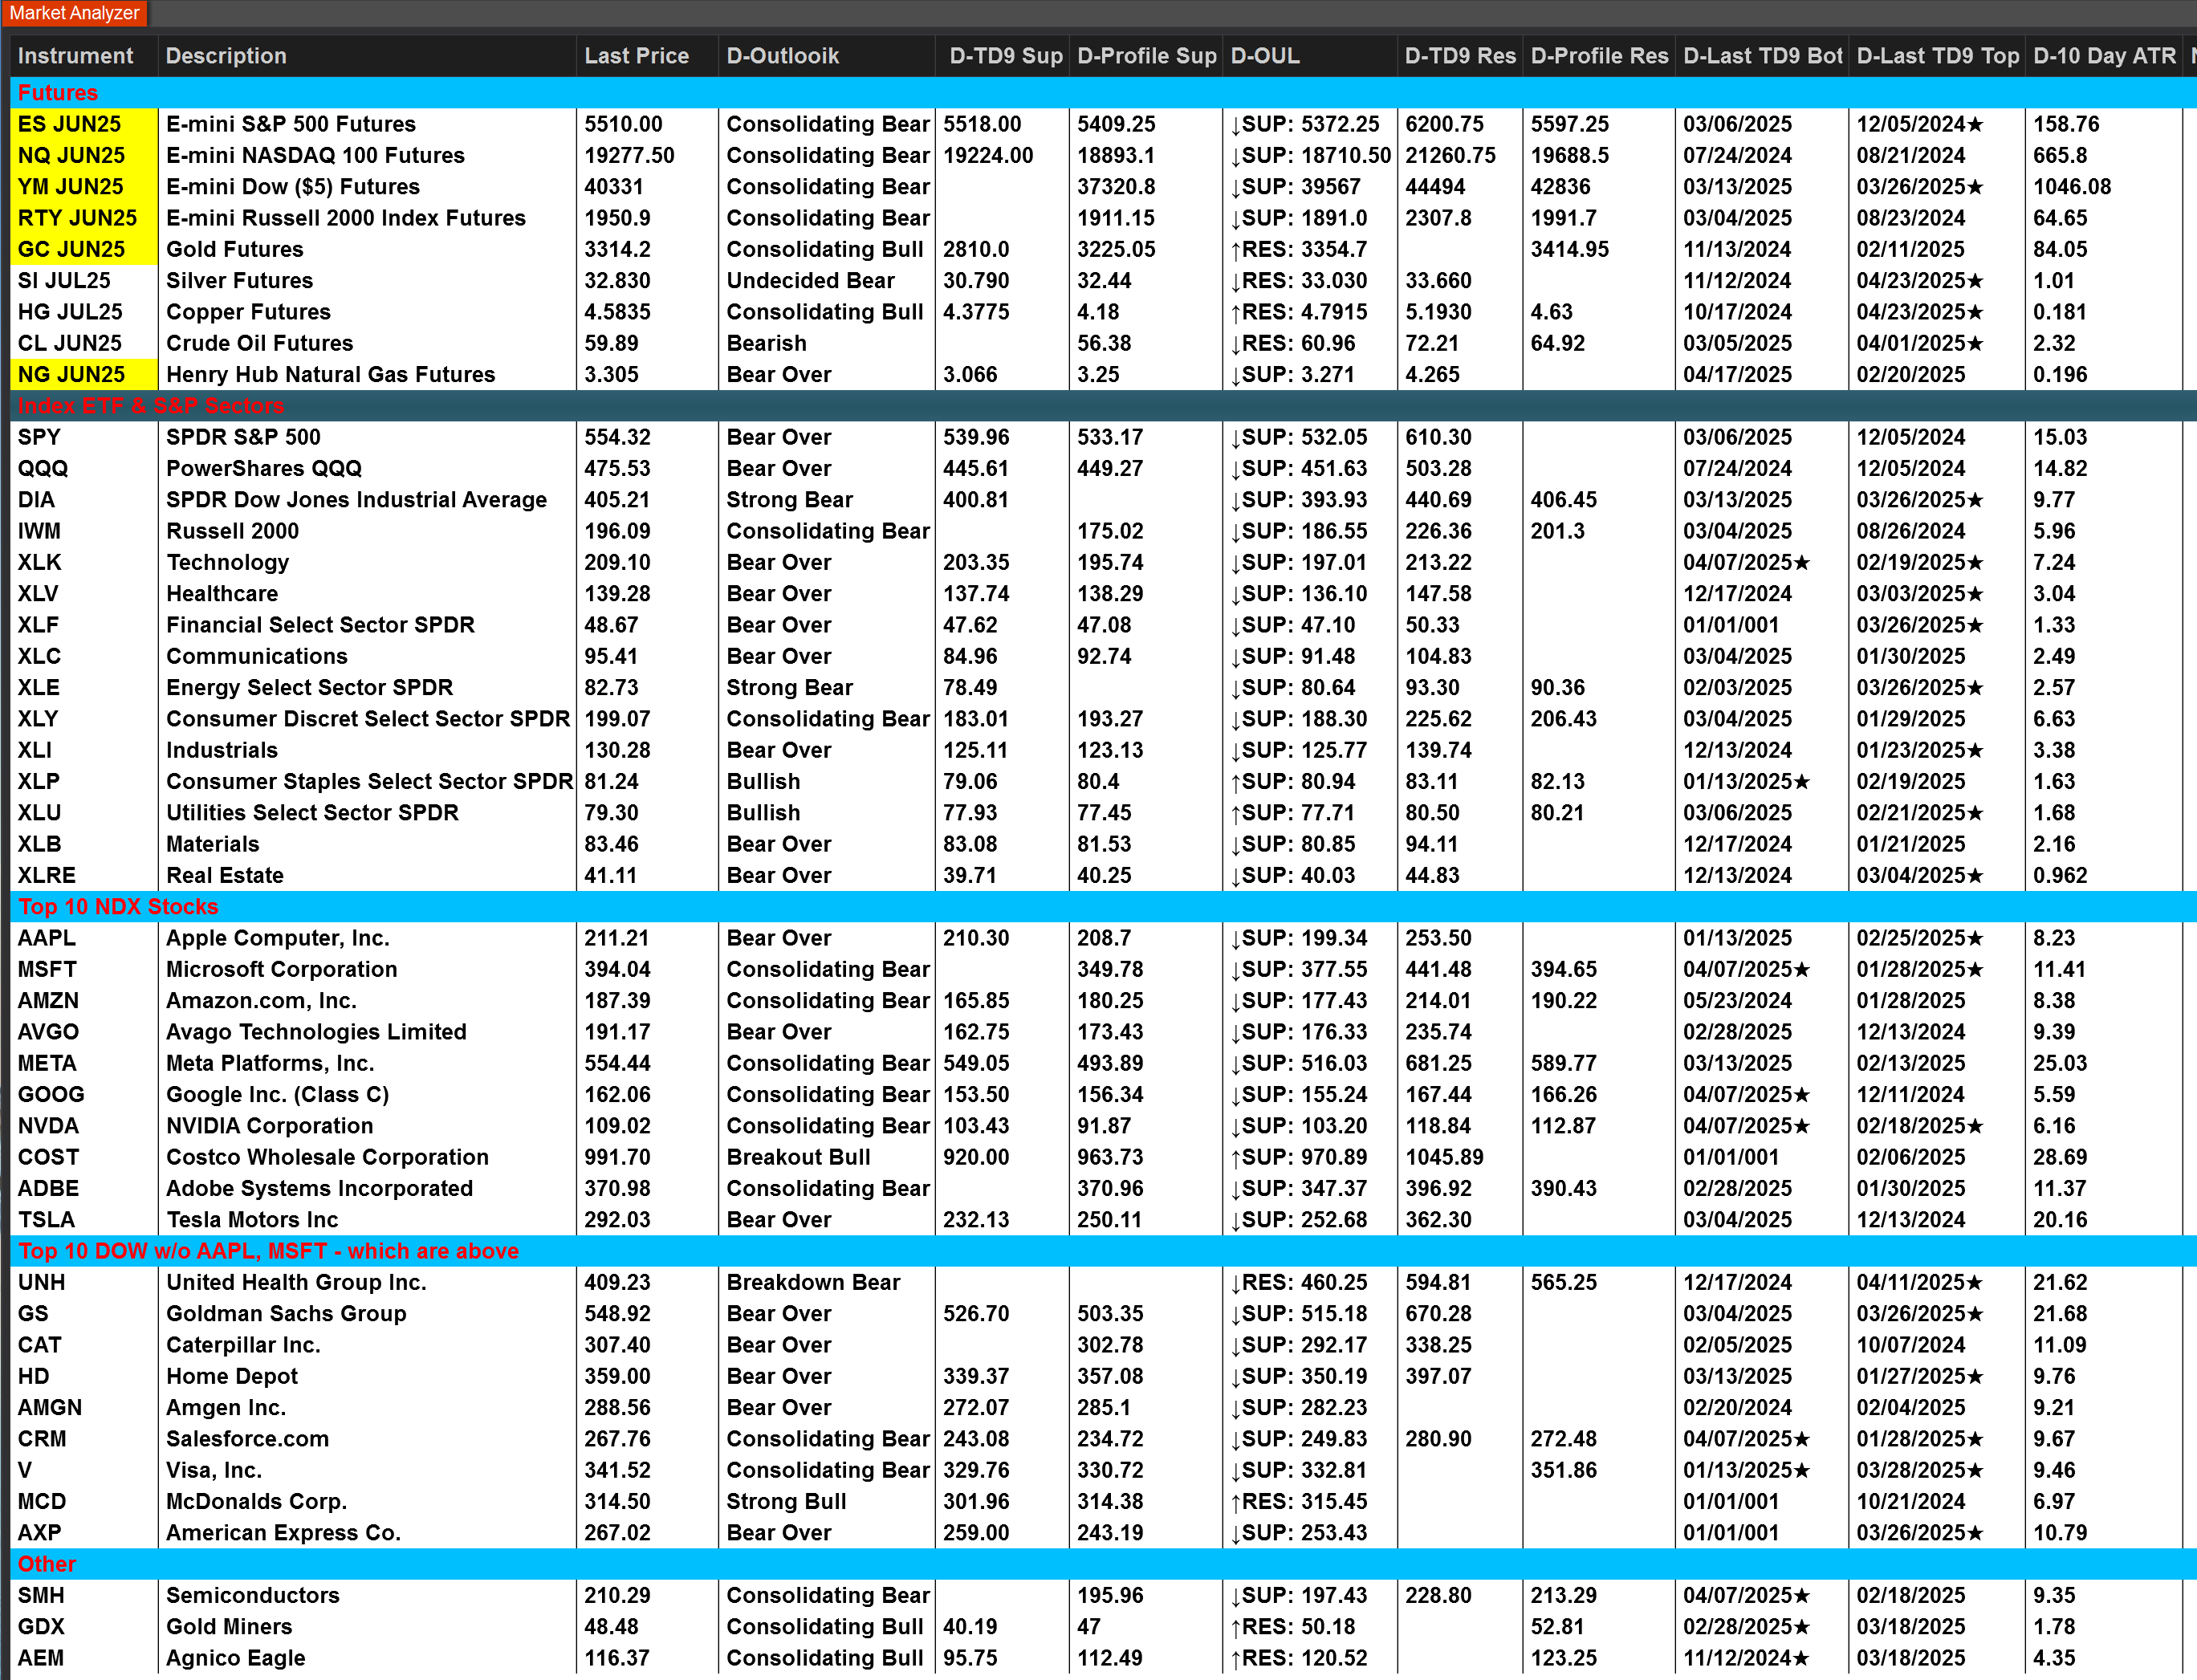
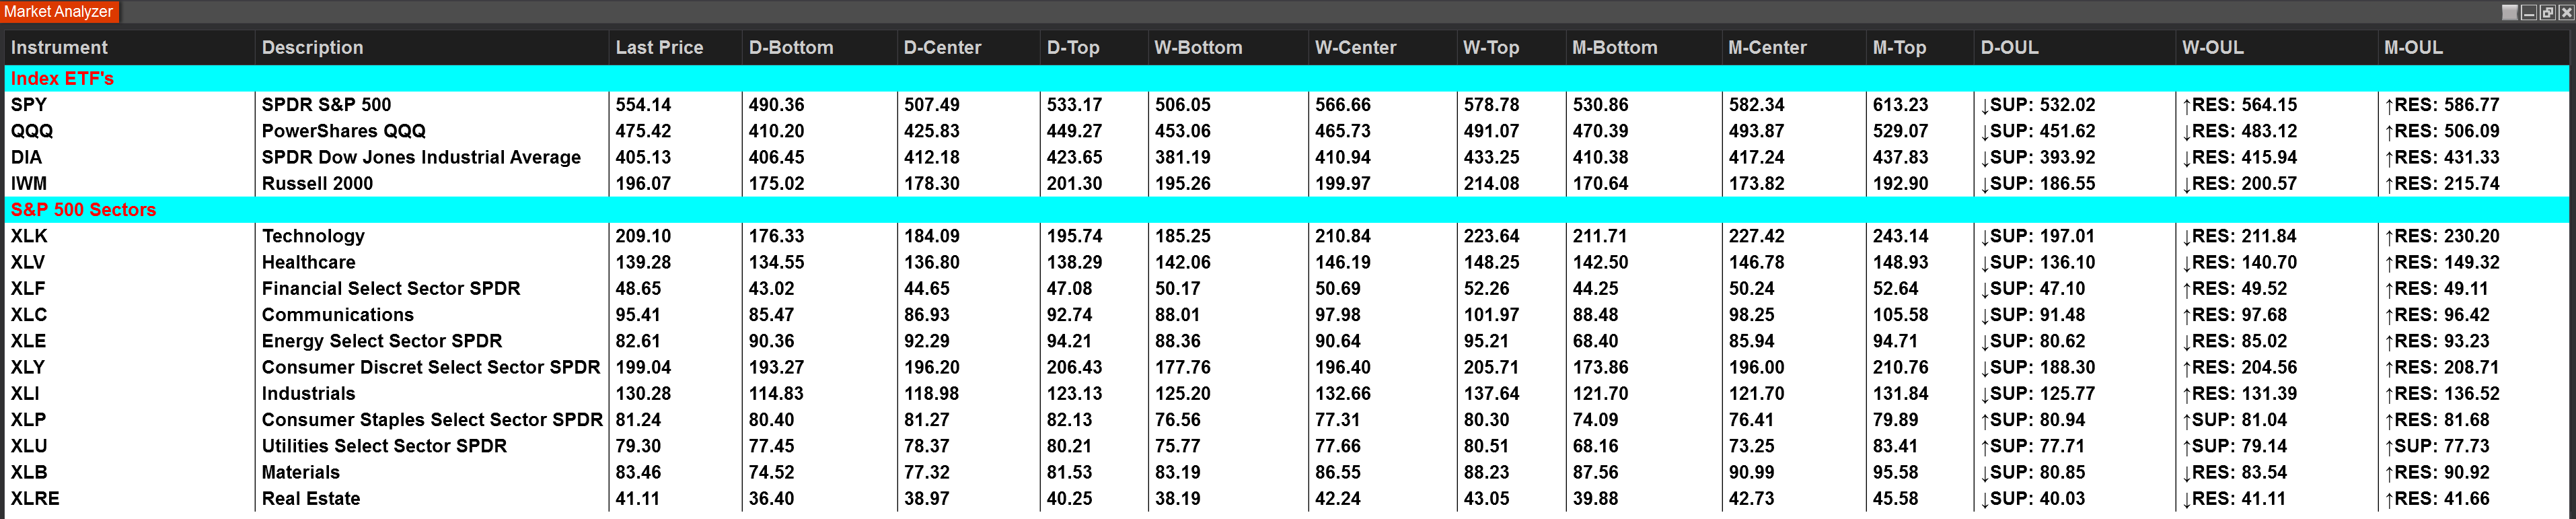
Legend:
An up arrow (↑) in the OUL column tells us that the OUL is green, meaning that its price oscillator is above zero and that momentum is to the upside or bullish.
A down arrow (↓) in the OUL column tells us that the OUL is red, meaning that its Price Oscillator is below zero and that momentum is to the downside.
SUP means that price is above its OUL and thus the OUL price level as shown is support on a move lower.
RES means that price is below its OUL and therefore the OUL price level shown is resistance on a rally.
The most bullish condition is an up arrow with SUP meaning that its OUL is green with price trading above it and therefore we have a rising Price Oscillator above zero, a bullish condition that should target upside resistance if any exists.
Likewise, the most bearish condition is a down arrow with RES meaning that its OUL is red with price trading below it and therefore we have a falling Price Oscillator below zero, a bearish condition that should target downside support if any.
Profile support and resistance tell you where the next battle should be in either direction if a profile exists. If the column is blank then price is trading outside of the profile.
A market overview as of 9:03 a.m.
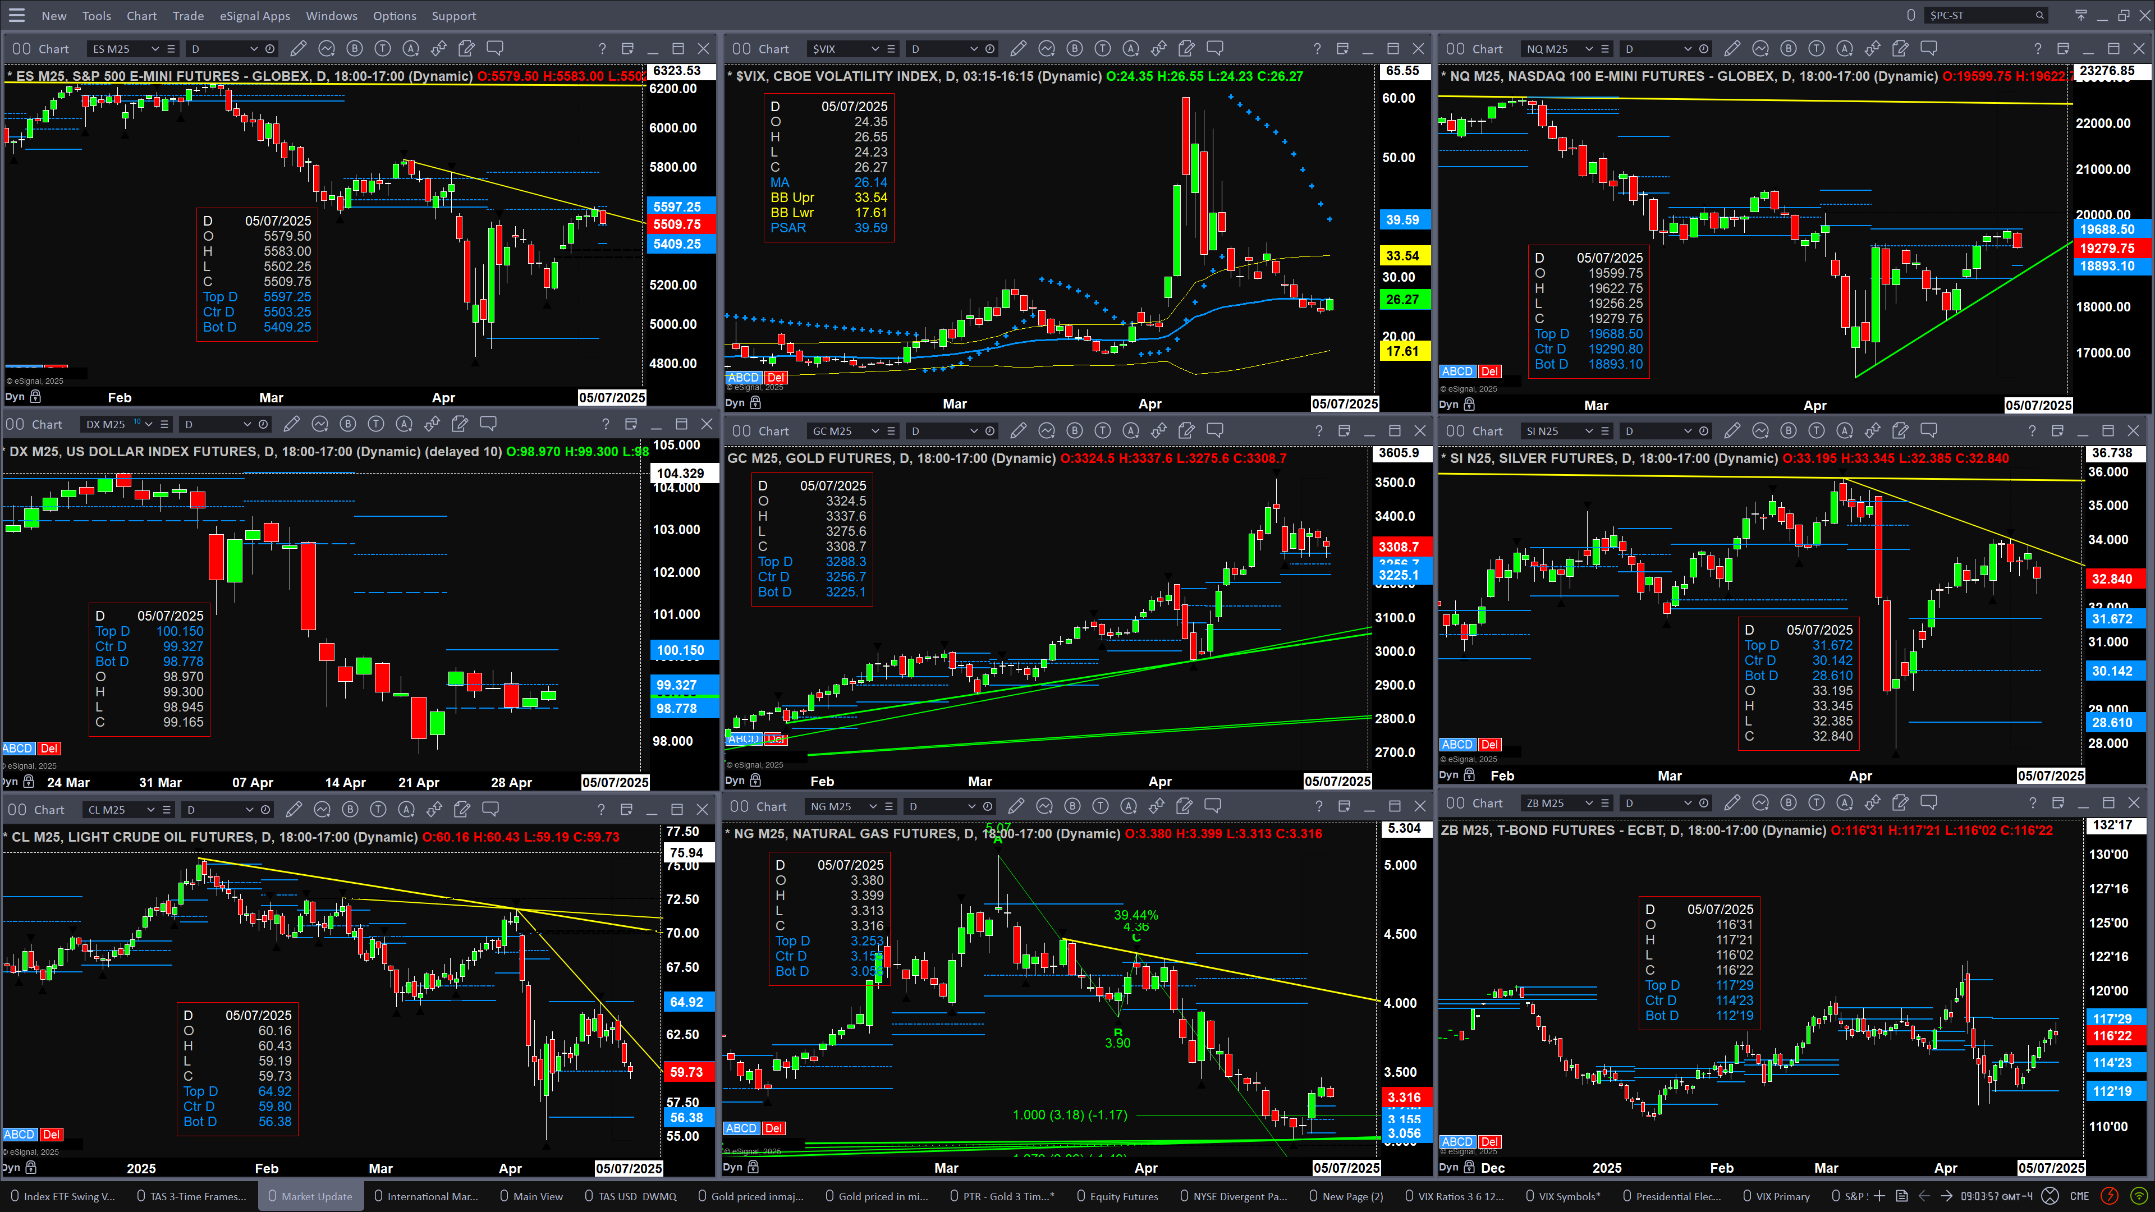
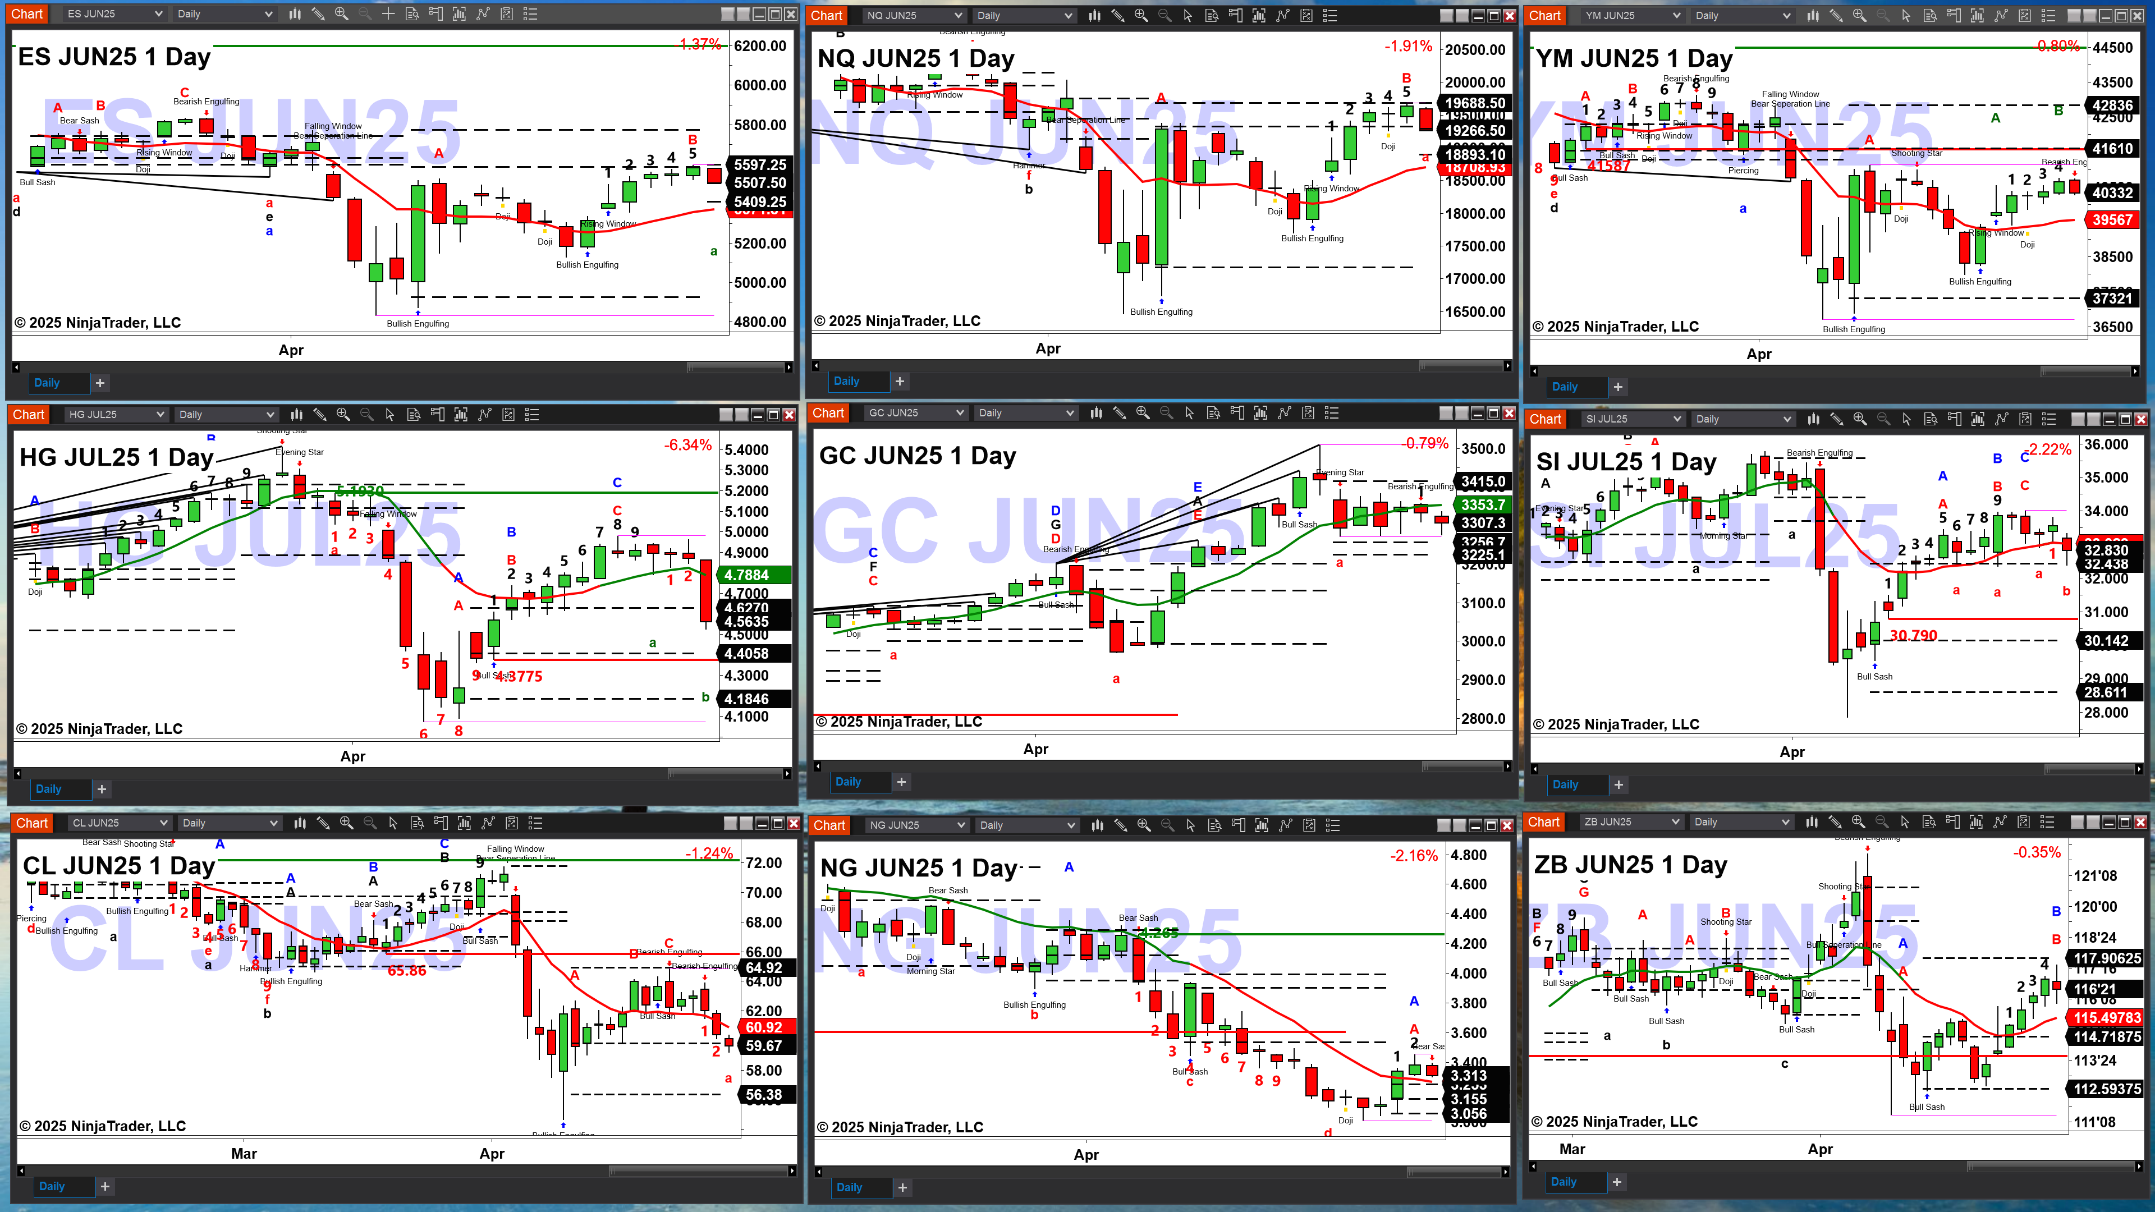
The daily ES has a buy the D point bottom with price trading within its new profile that has support at 5409.25 and a sell zone between 5503 & 5597.25.
The spot VIX index is testing its 50-day EMA and a close above 26.14 would suggest that sellers would have an edge.
The daily NQ has a buy the D point bottom with price finding resistance at its sell zone between 19290 & 19688.50. A close below 19290 would suggest a run for its OUL, 18712.
The daily YM has a buy the D point bottom with price trading above its OUL which increases the odds of a further rally with its sell zone being a price target, 41610 – 42836.
The daily RTY has a buy the D point and RMI bottom with price trading within its new profile that has support at 1911.20 and resistance at 1991.70.
The daily U.S. dollar index is trading within its profile that has support at 98.745 and resistance at 100.151.
The daily Gold chart has a RMI top with price trading within its bullish structured profile that has support in the 3225.10 – 3256.70 zone with resistance at 3415.
The daily Silver chart has a TD9 top with price trading below its red OUL and that suggests a run for profile support at 31.67.
The daily Copper chart has a TD9 top with price trading back inside its profile and may be targeting its breakout area, 4.3775.
The daily Crude Oil chart has a buy the D point bottom with price trading below its red OUL and may be signaling a move to the bottom of its profile, 56.38.
The daily Natural Gas chart needs a bullish reversal candle to generate a buy the D point bottom. Price remains above its red OUL and top of its new profile which suggests a run for its TD9 breakdown area, 4.265.
The daily chart for T-bonds is trading within its profile that has support at 112’15 and resistance at 117’31.
The daily chart for T-Notes shows that price is trading within its profile that has support at 109’24 and resistance at 114’10.
The NYSE Advance/ Decline Oscillator closed above its +150 area which places it into overbought status. It also signals that we should anticipate higher price in the future, whether that’s today, tomorrow or further out.
In overnight trading,

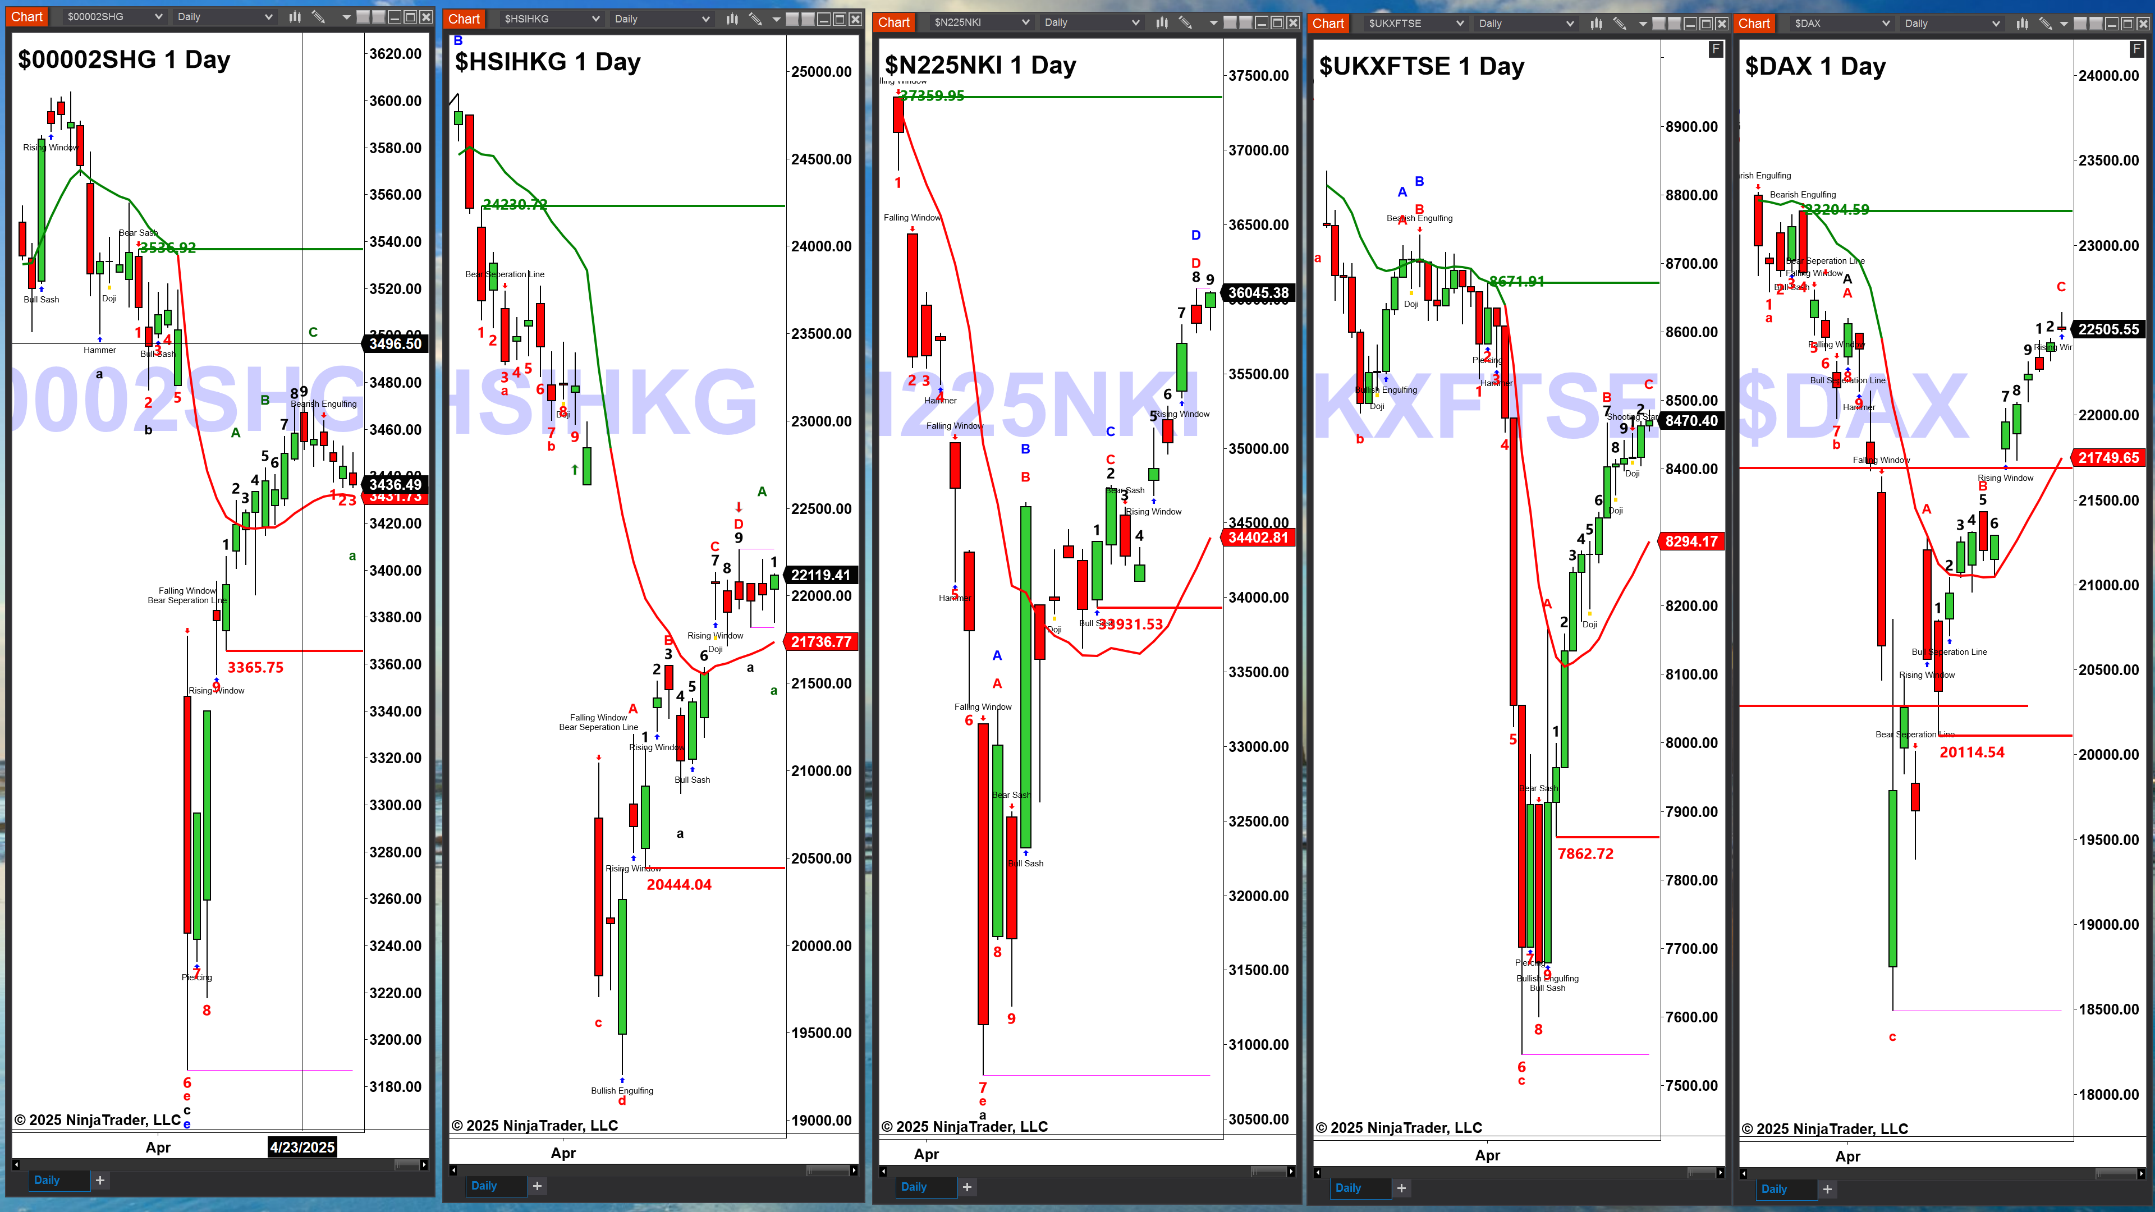
Markets in Asia show that:
The Shanghai index has a TD9 top which suggests a retracement back towards its OUL.
The Hang Seng has a TD9 top that should retrace towards its OUL.
The Nikkei 225 has a TD9 topping pattern that will complete tomorrow.
Markets in Europe are trading higher as of 6:11 a.m.
The FTSE has a buy the D point bottom with price trading above OUL resistance which increases its odds of a further rally.
The DAX has a TD9 top that would be negated with a close above 22443.41 today.

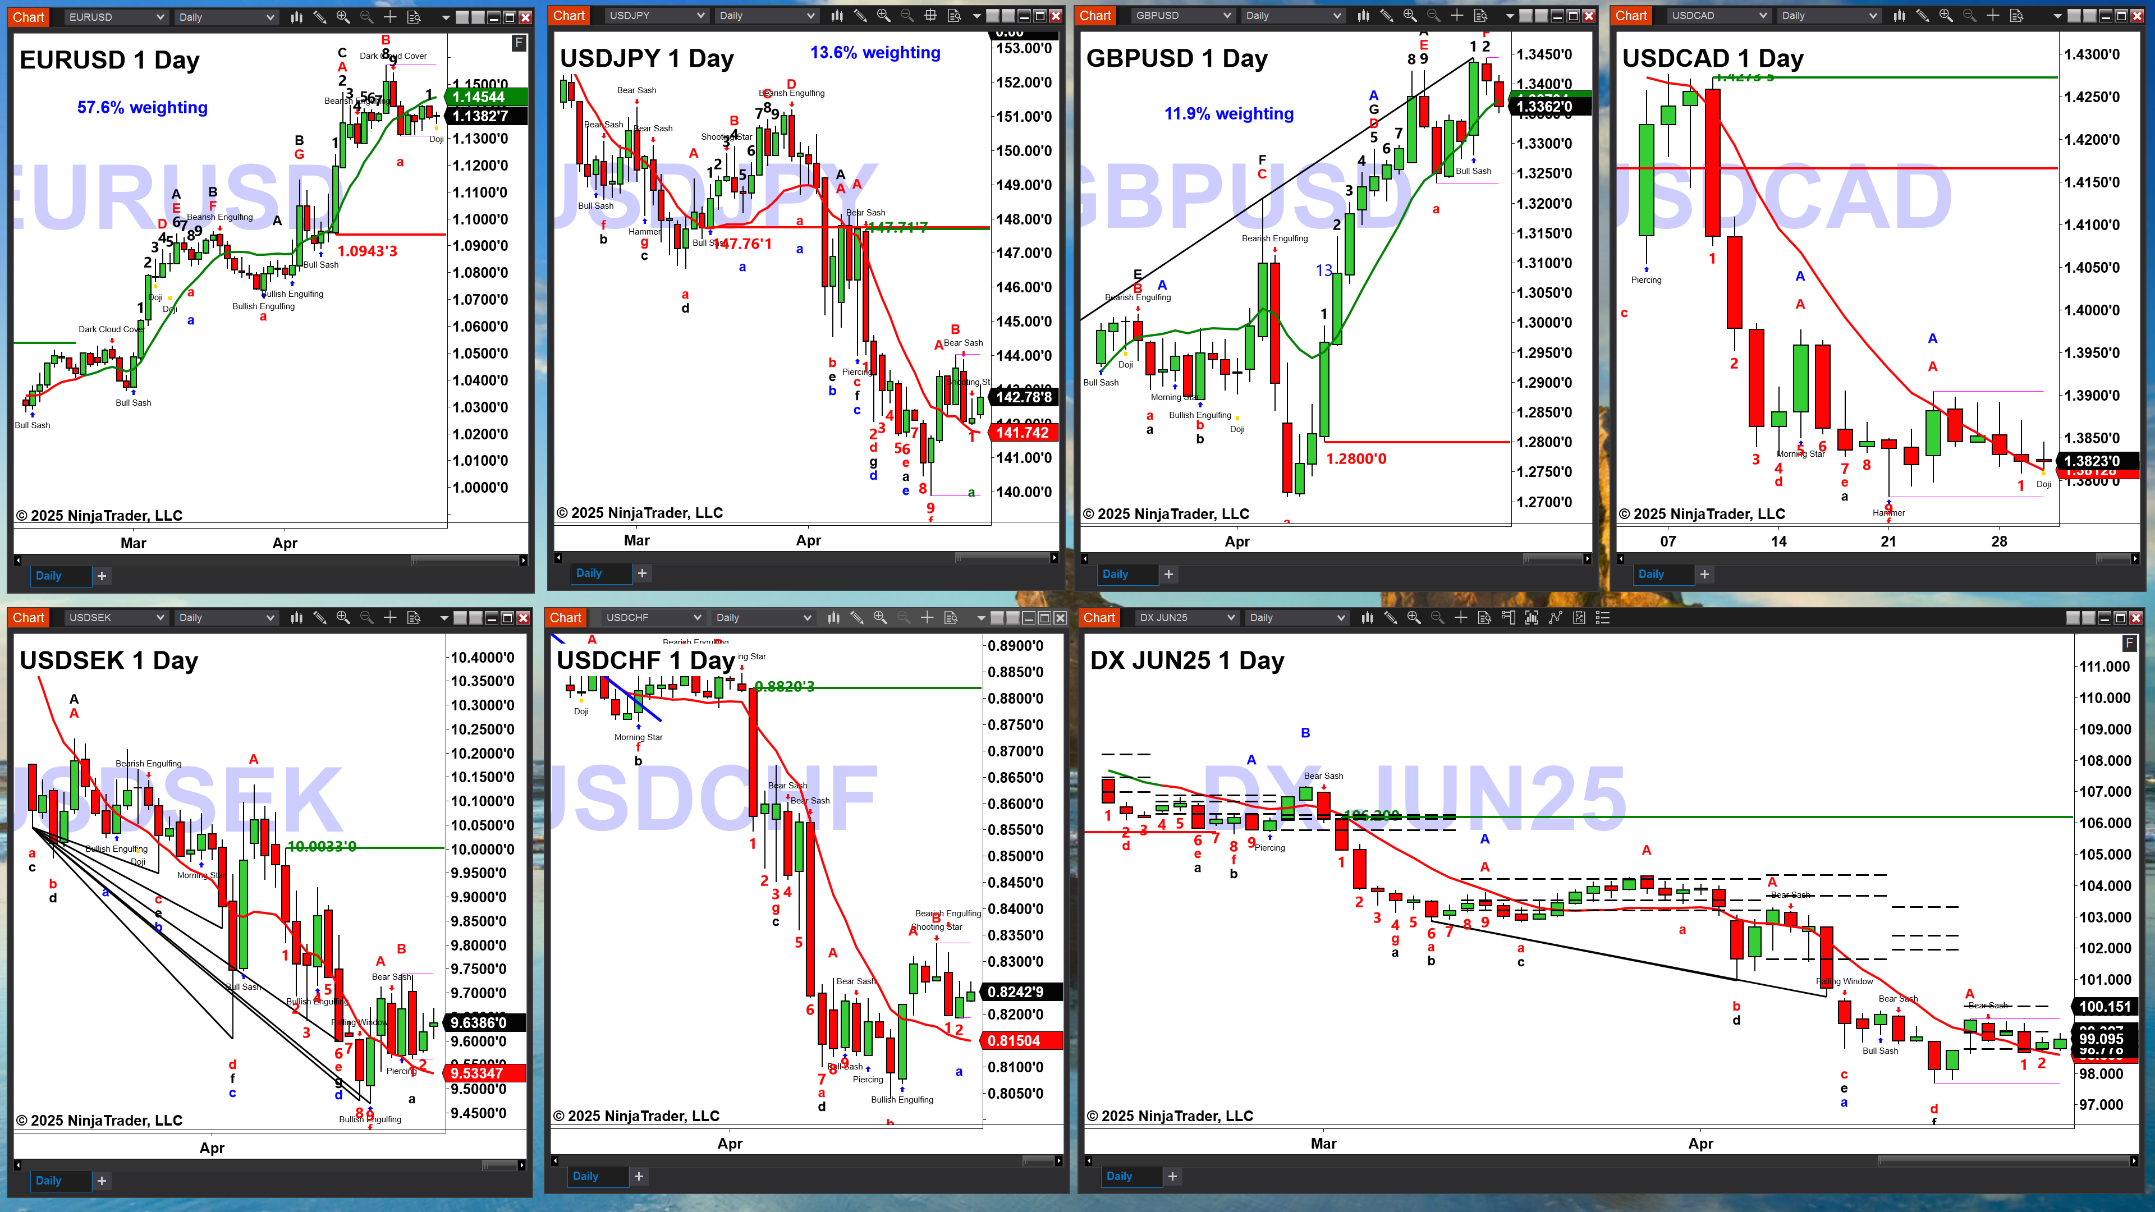
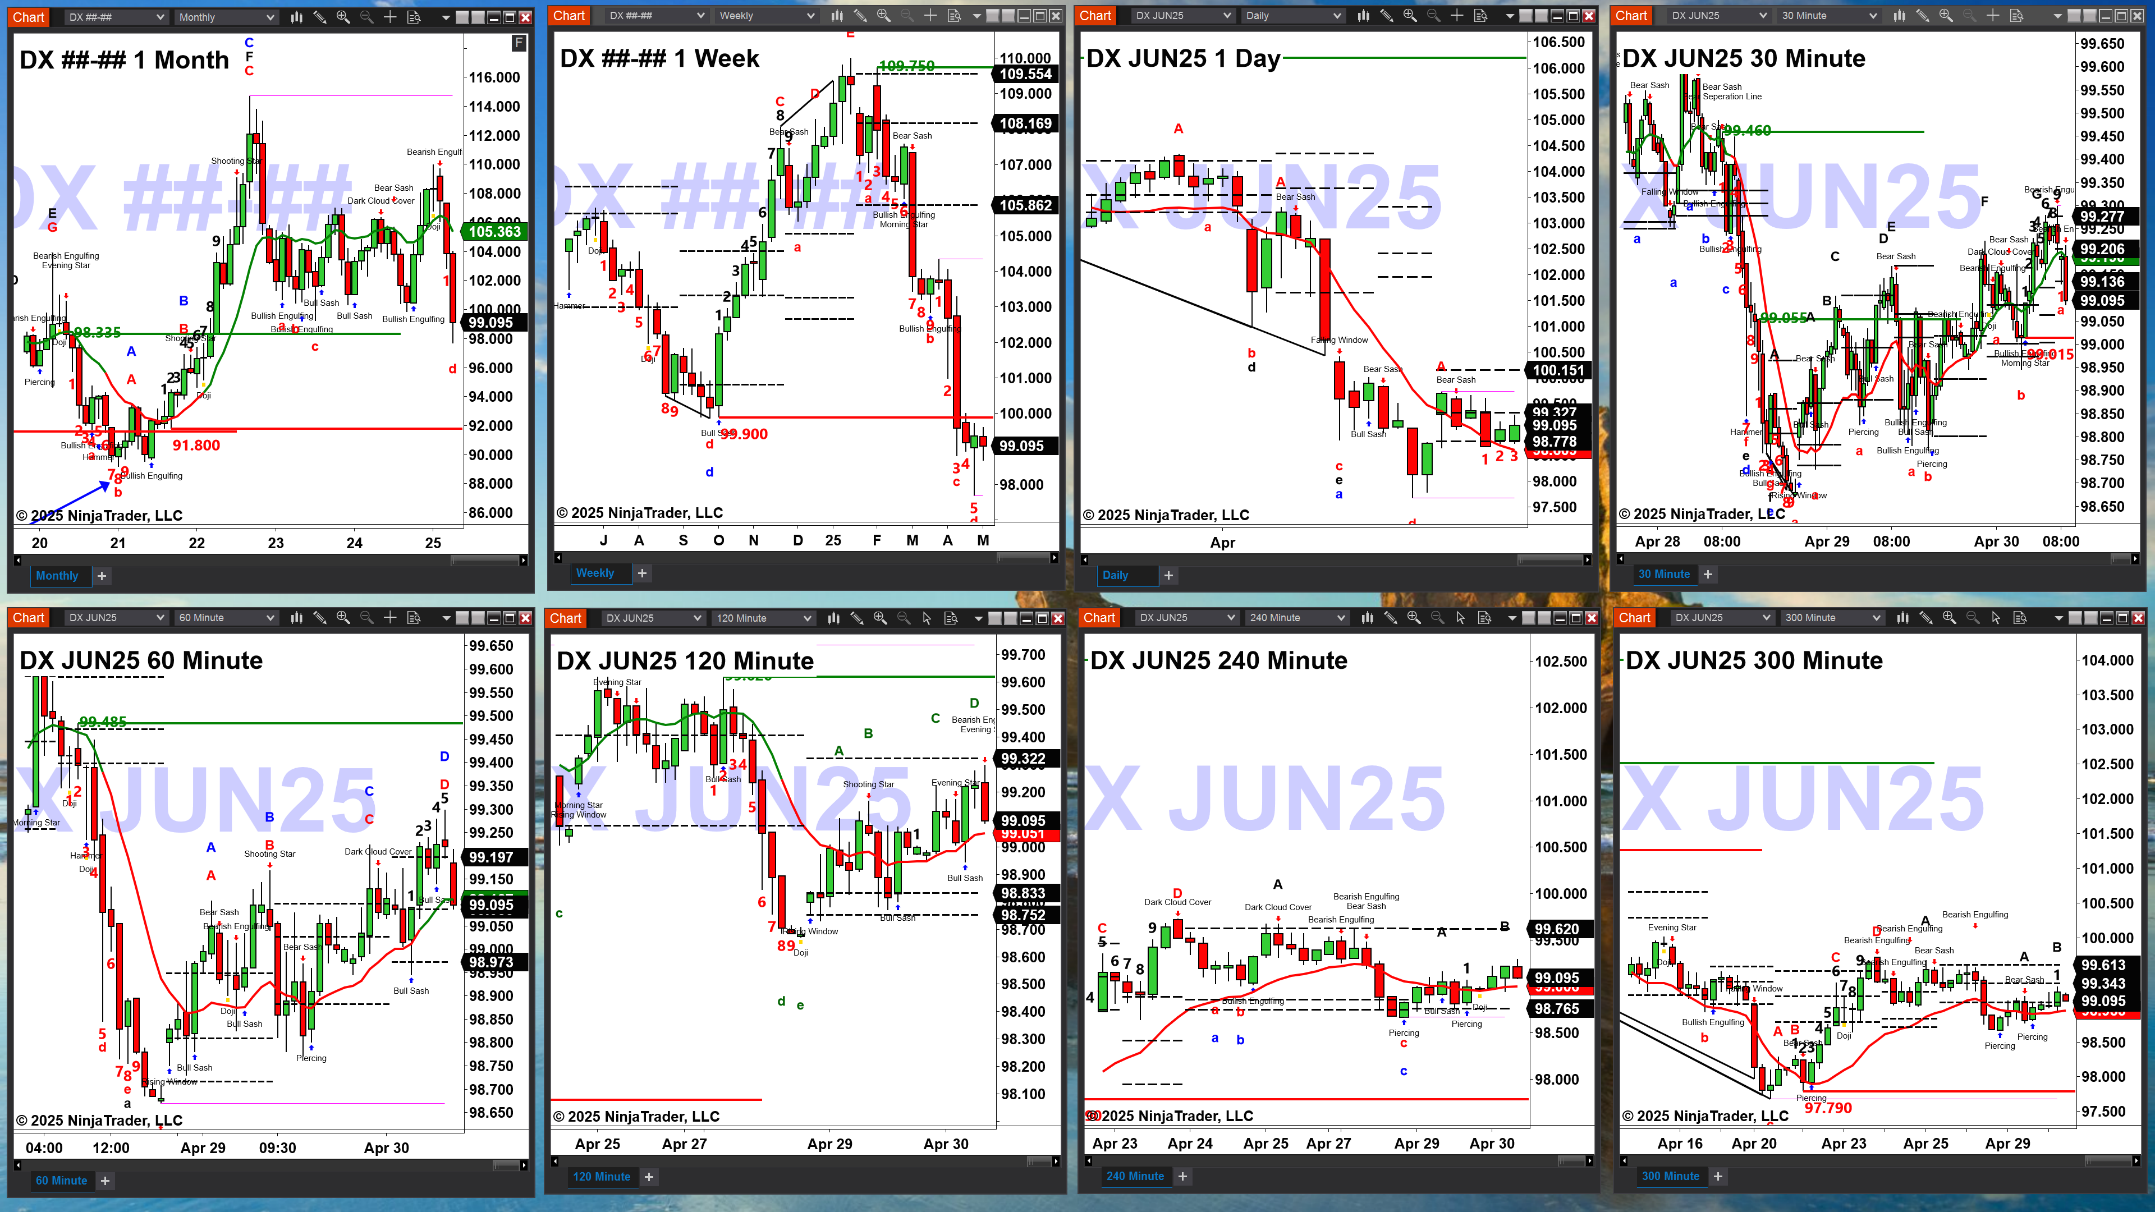
The daily U.S. dollar index is trading within its profile that has support at 98.745 and resistance at 100.151.
The weekly U.S. dollar index remains below its TD9 breakout level at 99.945 which increases its odds of moving lower.
The monthly chart could be targeting its breakout level, 91.80.
The euro has a sell the D point and TD9 top and as long as price remains below its OUL, a further retracement is likely.
The Yen has formed a TD9 bottom and as long as price remains above its OUL, a further rally is likely.
The Great British Pound negated its TD9 top and needs a bearish reversal candle to generate a RMI top.
The Canadian Looney has a TD9 bottom with price trading sideways.
The Swedish Krona has both a TD9 and RMI bottom and may be rallying towards its TD9 breakdown level, 10.0033.
The Swiss Franc has a buy the D point bottom and should rally further.
U.S. equity futures are trading lower as of 8:54 a.m. this morning:

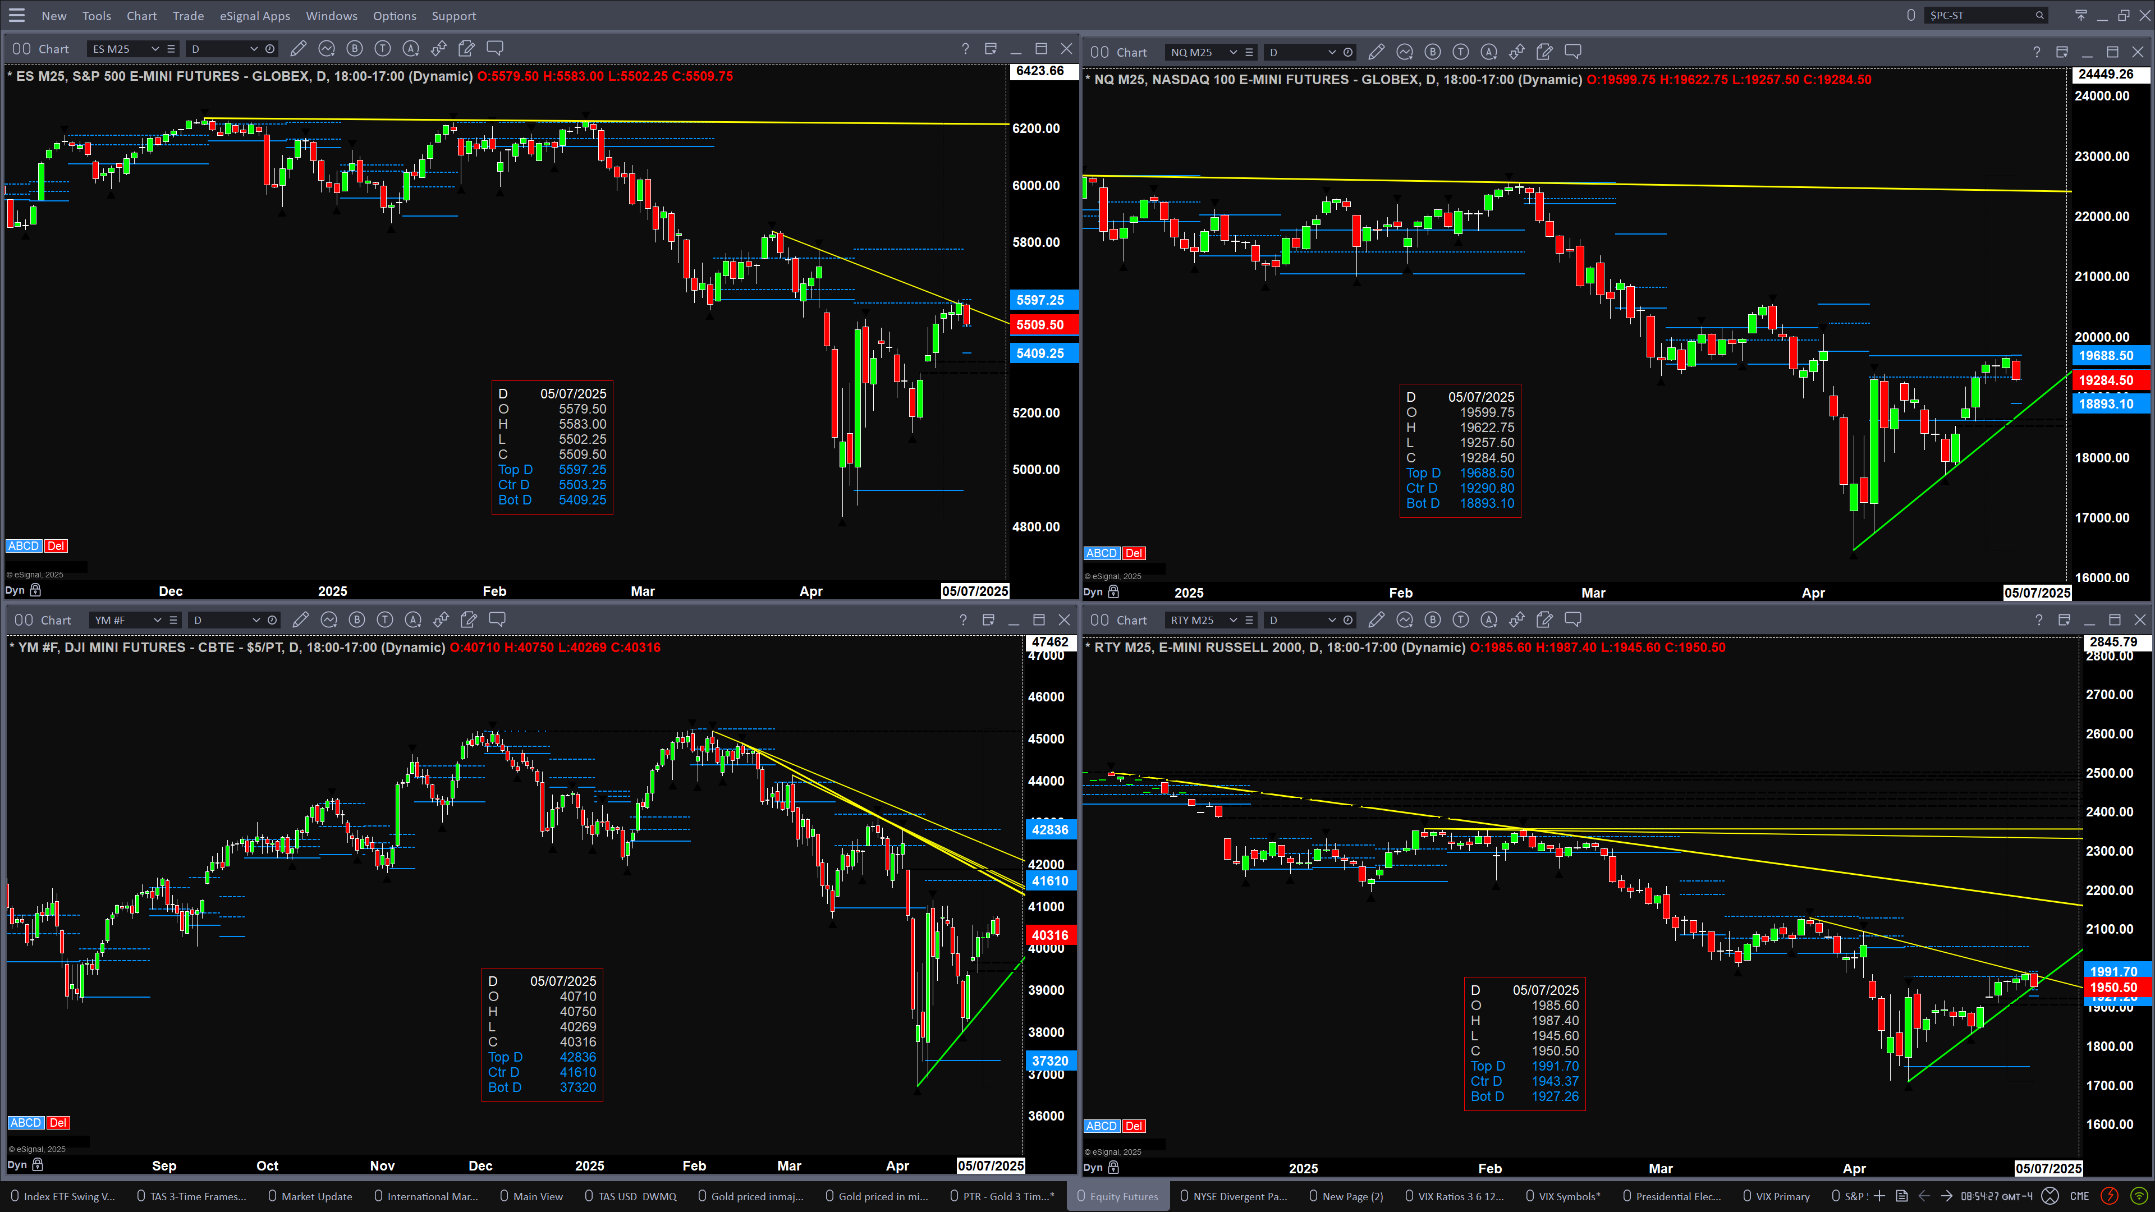
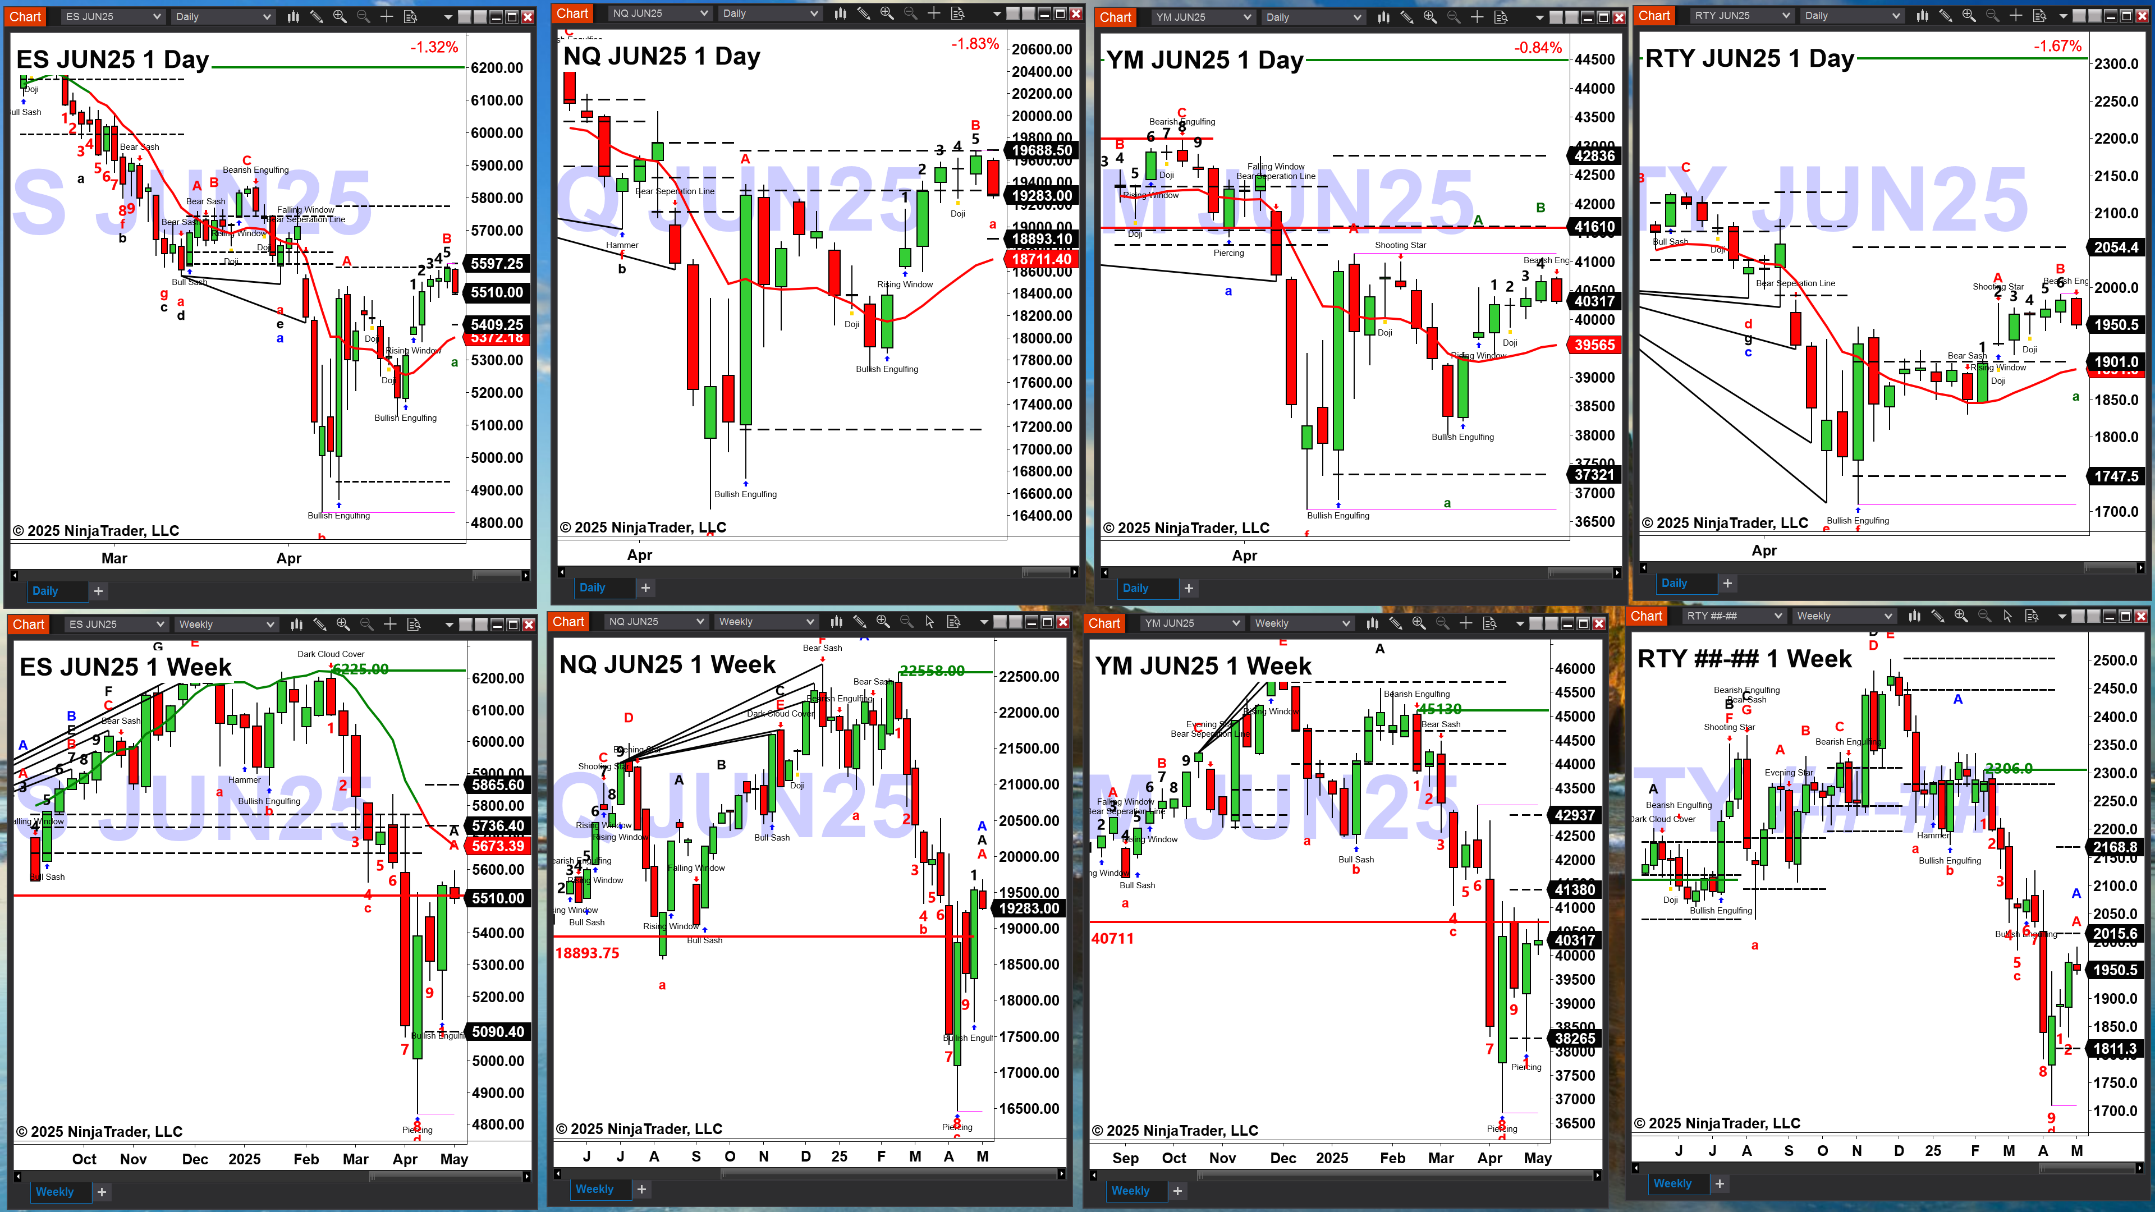
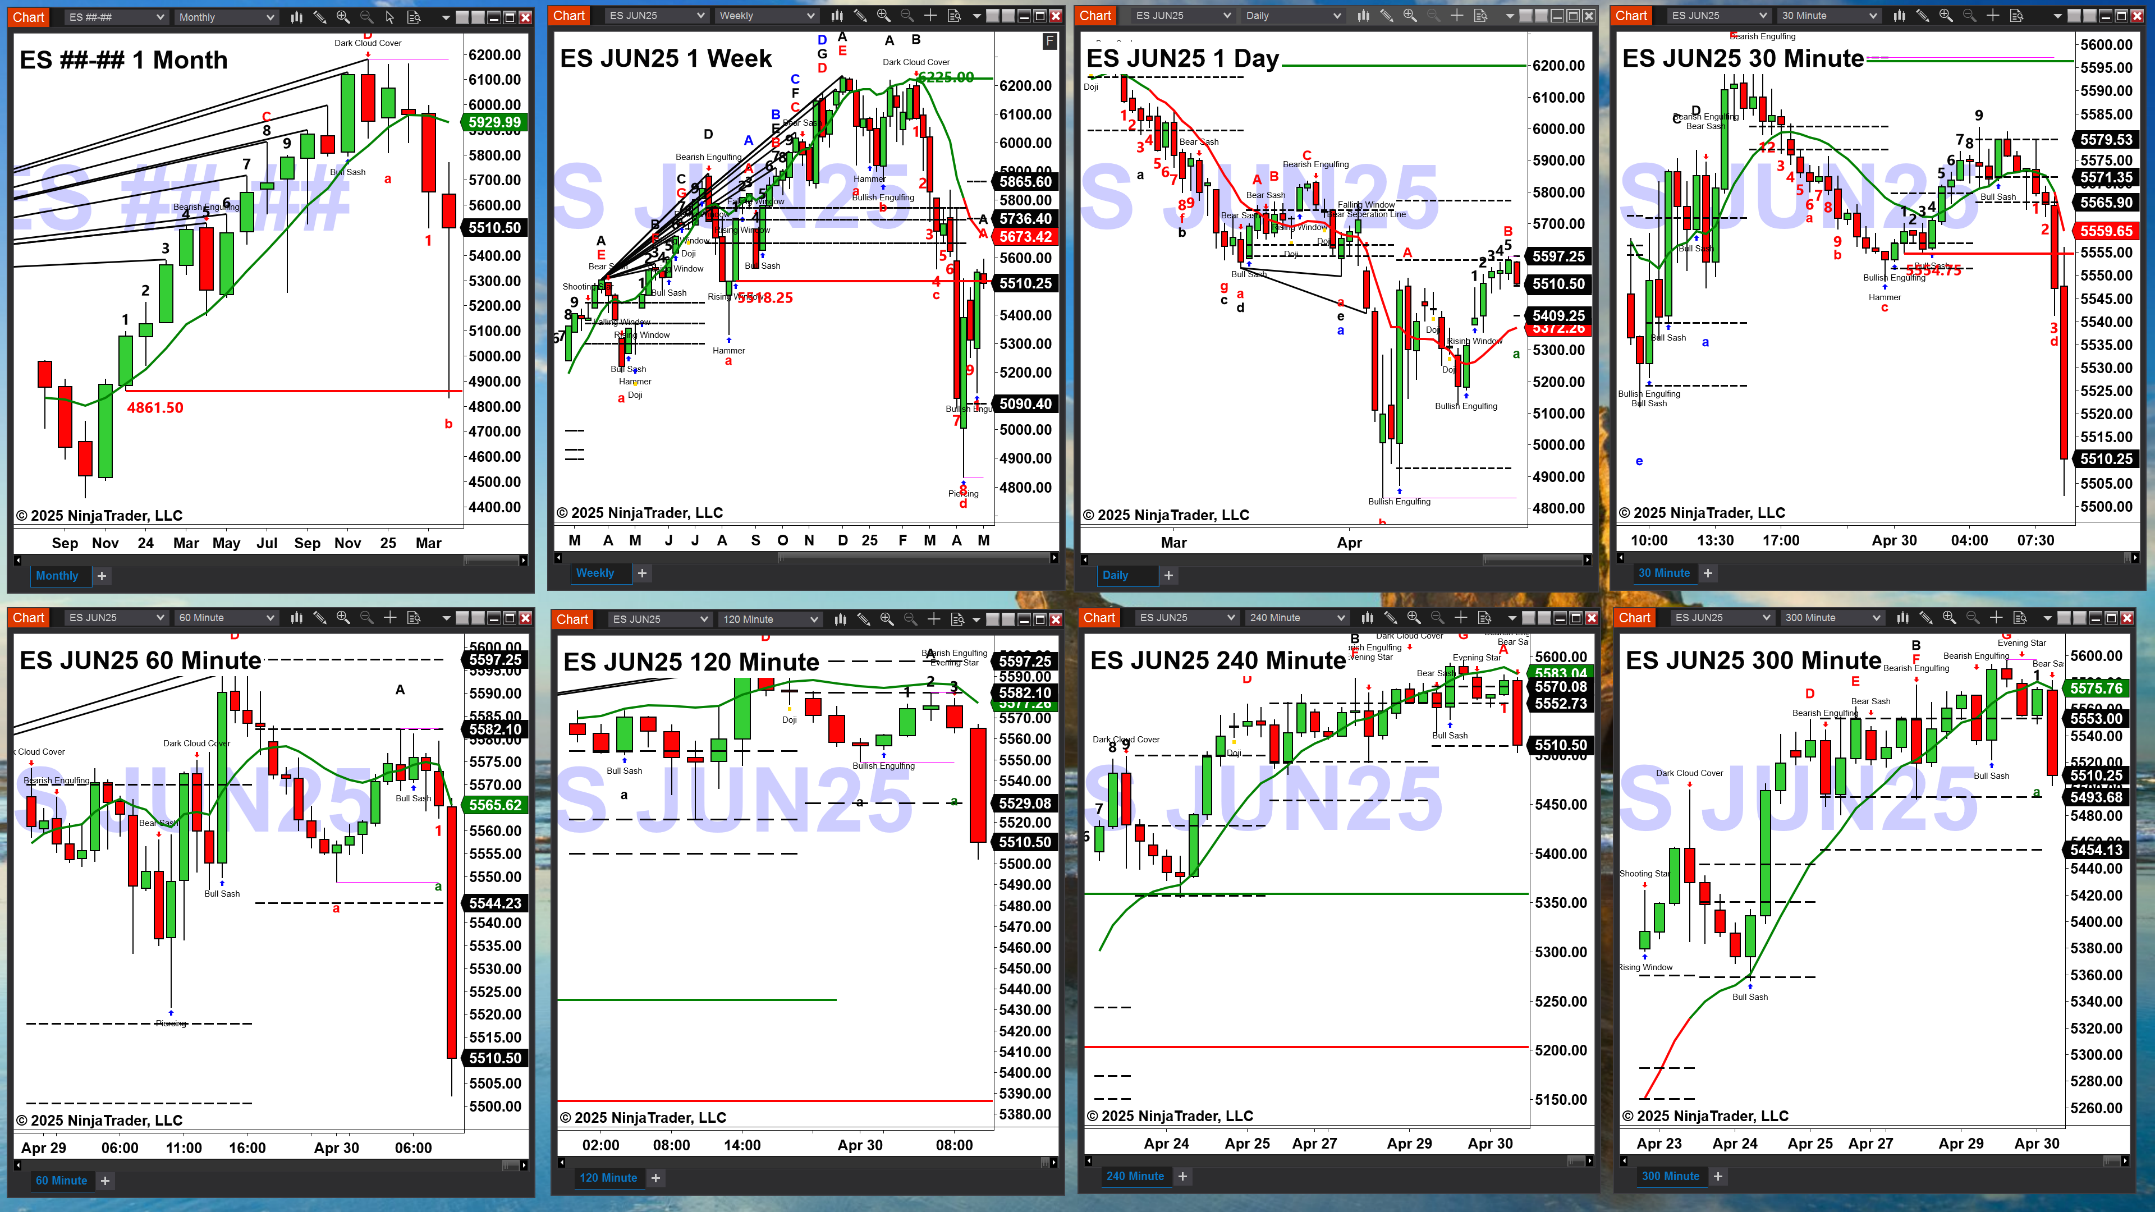
As of 8:55 a.m., the ES mini charts show that:
The monthly chart shows that price found support at its TD9 breakout area, 4861.50.
The weekly chart has a buy the D point bottom with price trading within its profile that has support at 5478 and a resistance zone between 5736 & 5865.
The daily ES has a buy the D point bottom with price trading within its new profile that has support at 5409.25 and a sell zone between 5503 & 5597.25.
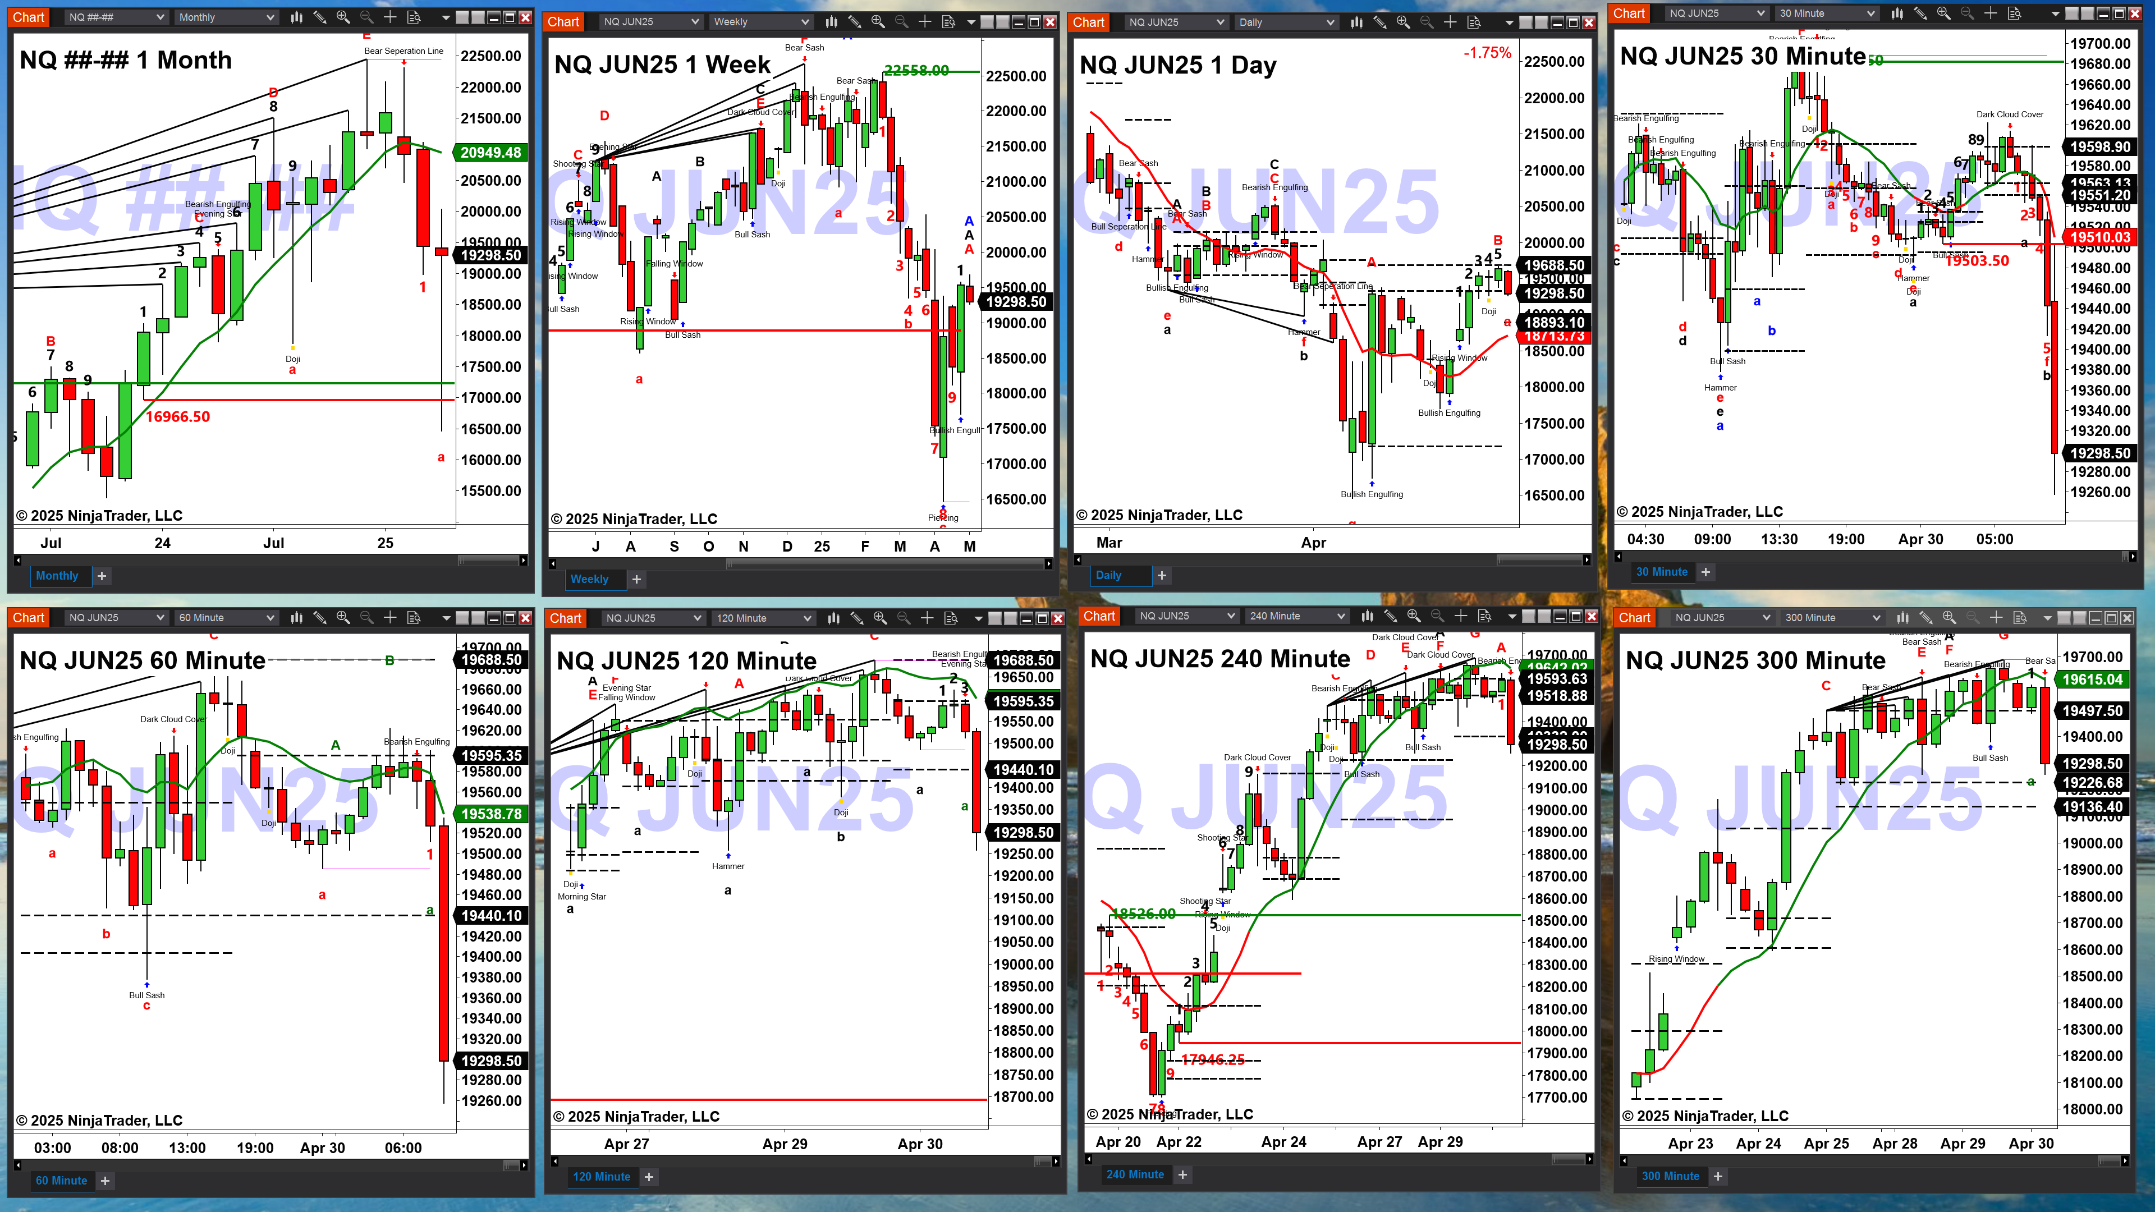
As of 8:57 a.m., the NQ charts show:
The monthly chart shows that price tested and rejected its TD9 breakout level, 16966.50.
The weekly chart has a buy the D point bottom pattern that should lead to a further rally.
The daily NQ has a buy the D point bottom with price finding resistance at its sell zone between 19290 & 19688.50. A close below 19290 would suggest a run for its OUL, 18712.
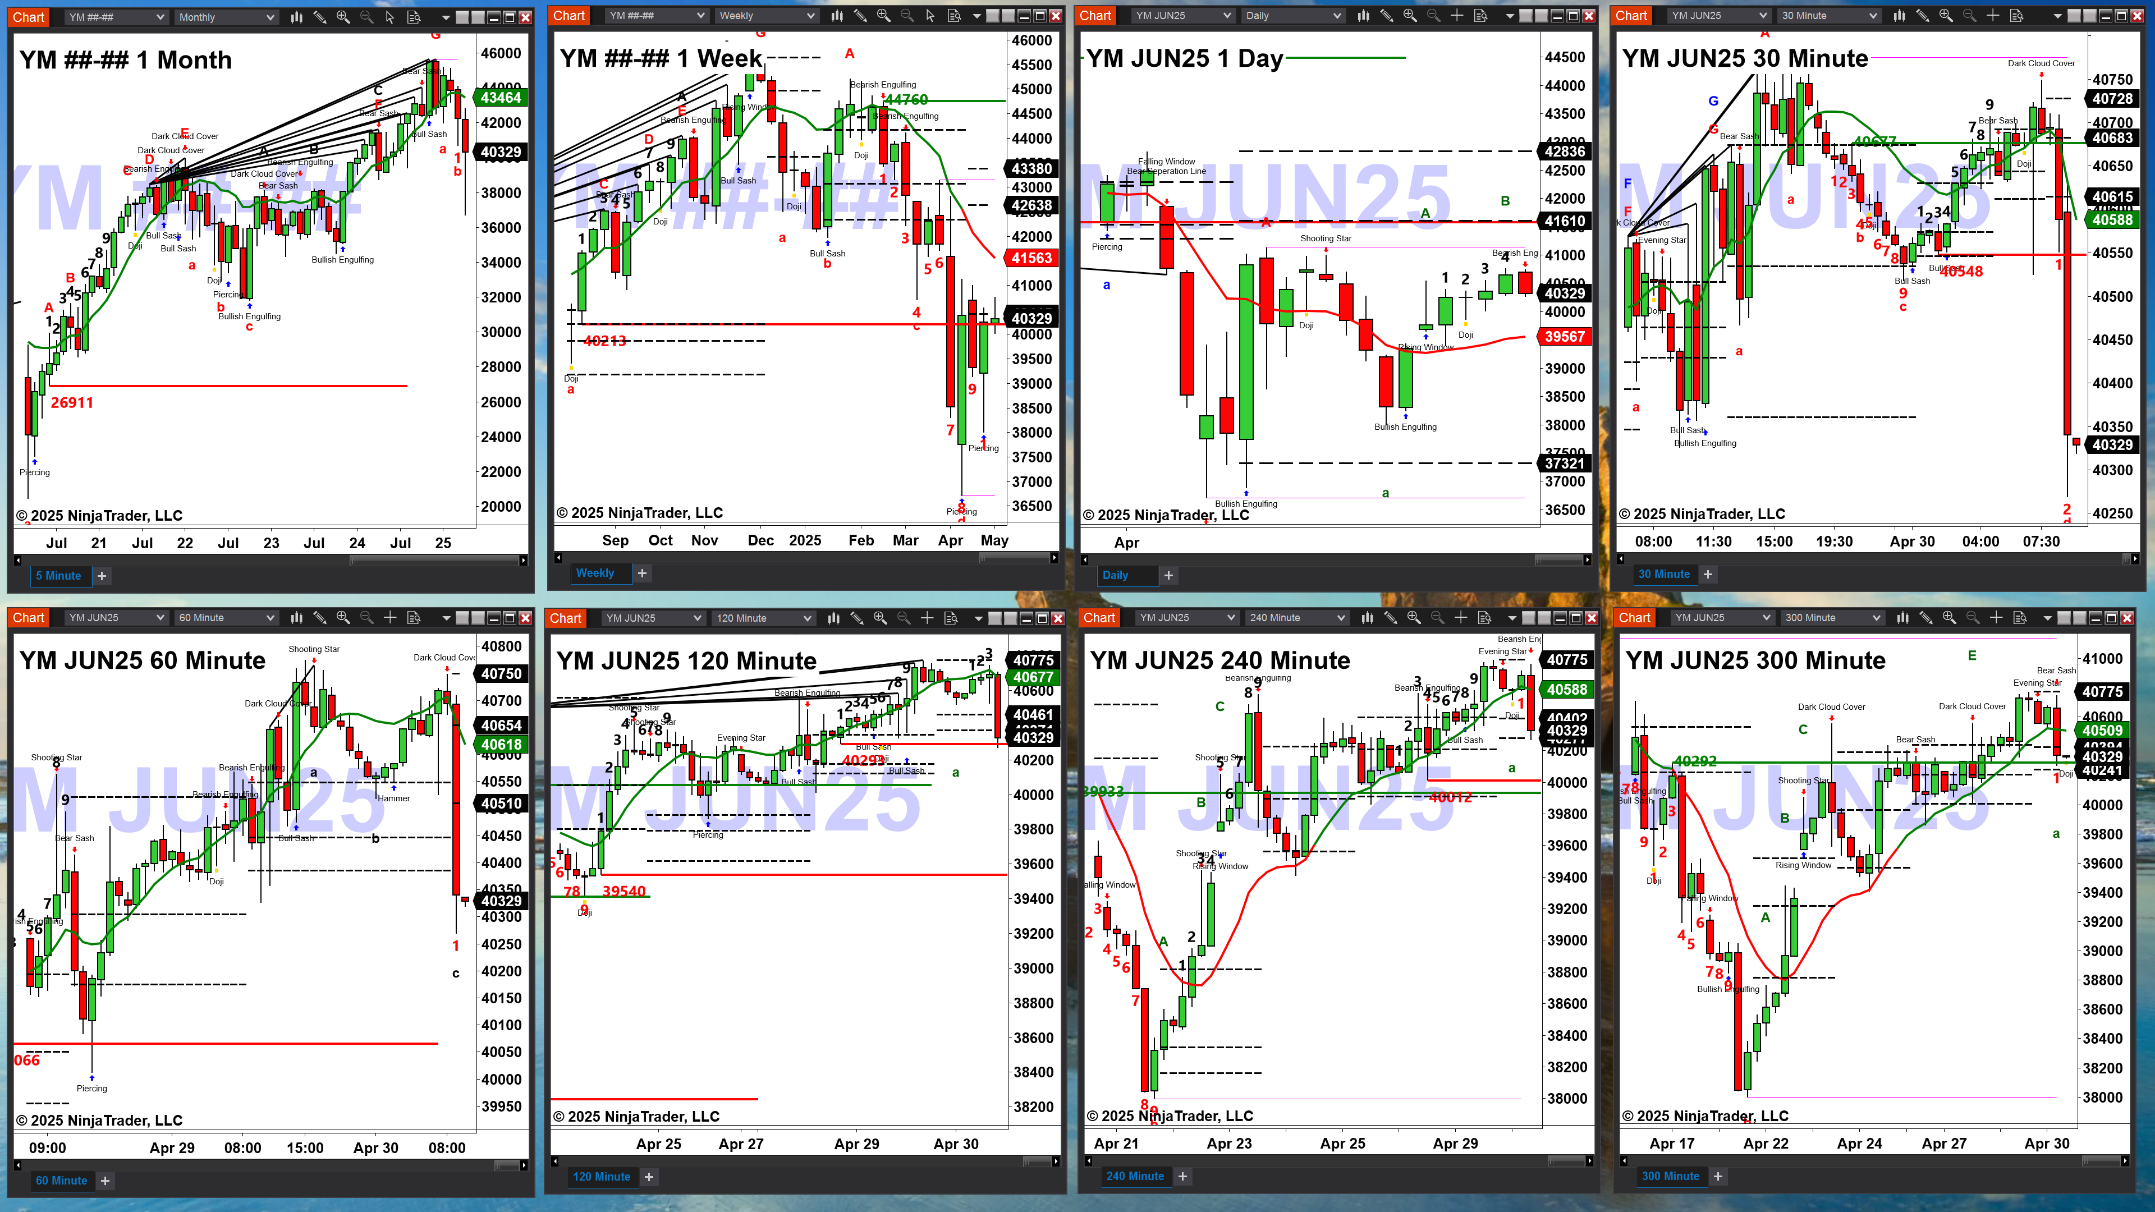
As of 8:59 a.m., the YM charts show:
The monthly chart has a wave 7 (G) top with price trading below its OUL and therefore a further move lower may unfold.
The weekly chart has a buy the D point bottom that should lead to a rally towards its OUL, 41554. Price is finding resistance at the bottom of its profile, 404415.
The daily YM has a buy the D point bottom with price trading above its OUL which increases the odds of a further rally with its sell zone being a price target, 41610 – 42836.
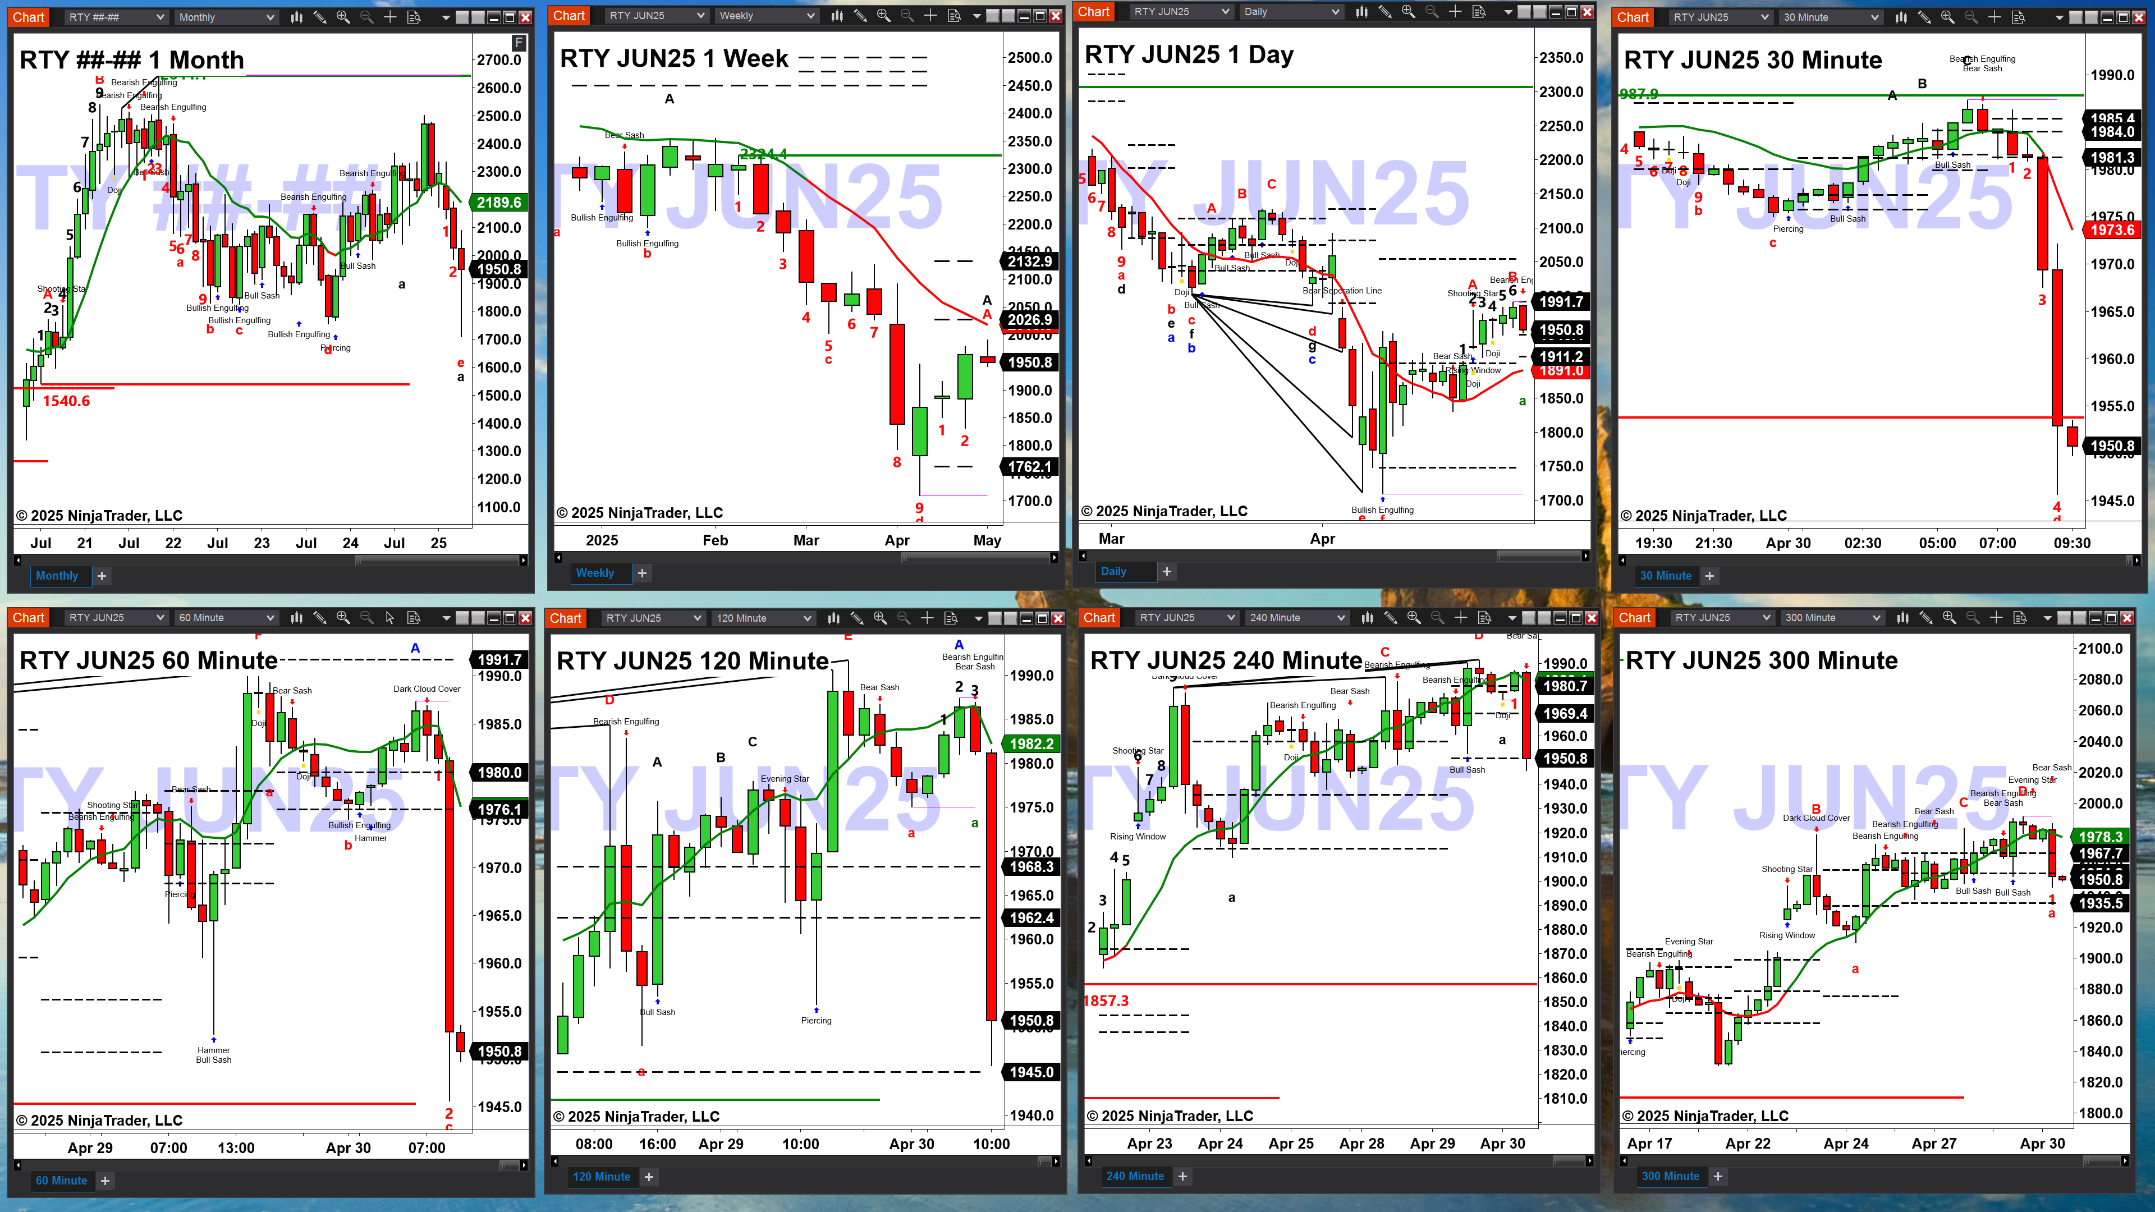
As of 9:01 a.m., the RTY charts show:
The monthly chart shows that price is trading into its October 2023 low.
The weekly RTY has a TD9 bottom pattern with price trading within profile that has support at 1762.10 and resistance in the 2026.90 – 2132.70 zone.
The daily RTY has a buy the D point and RMI bottom with price trading within its new profile that has support at 1911.20 and resistance at 1991.70.
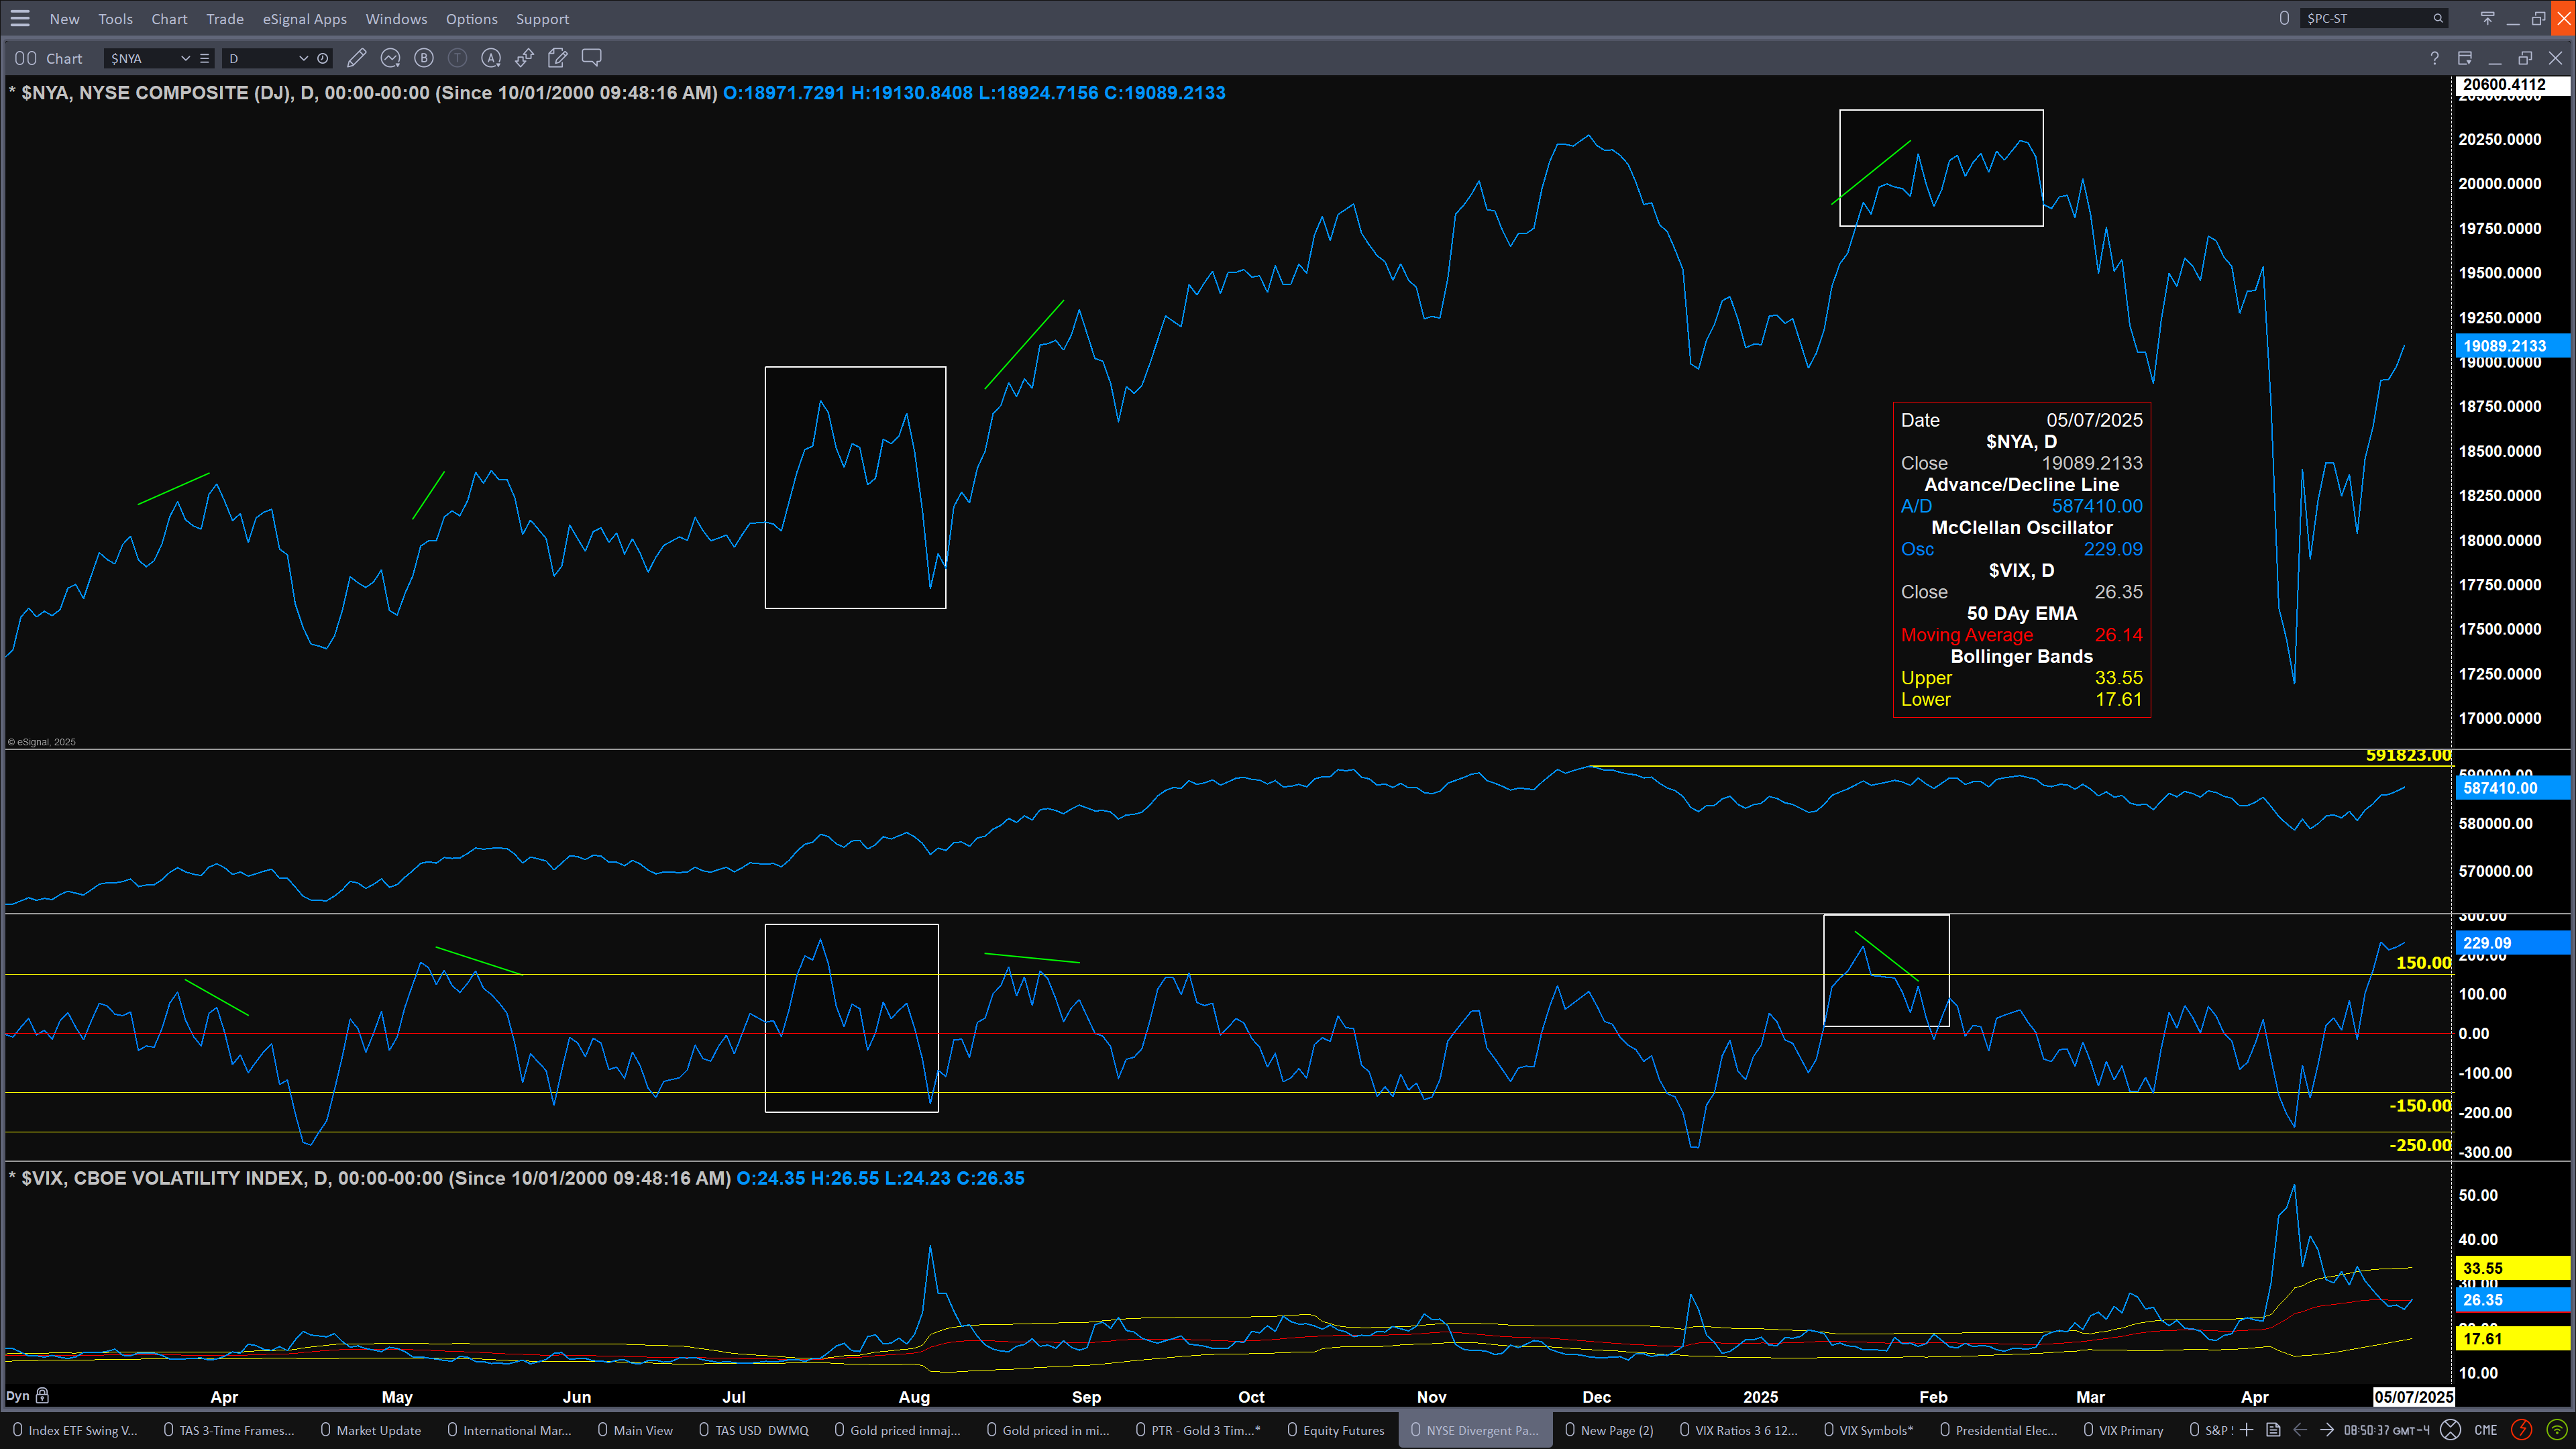
The NYSE Advance/Decline Oscillator has moved into very overbought conditions. This overbought level will be worked off either by price moving lower in the coming days or by price moving higher with an Advance/Decline Oscillator that moves lower and creates a divergence. The Advance/Decline Oscillator also signals that we should see higher price in the future, even the possibility of new all-time highs, but first, one thing at a time.
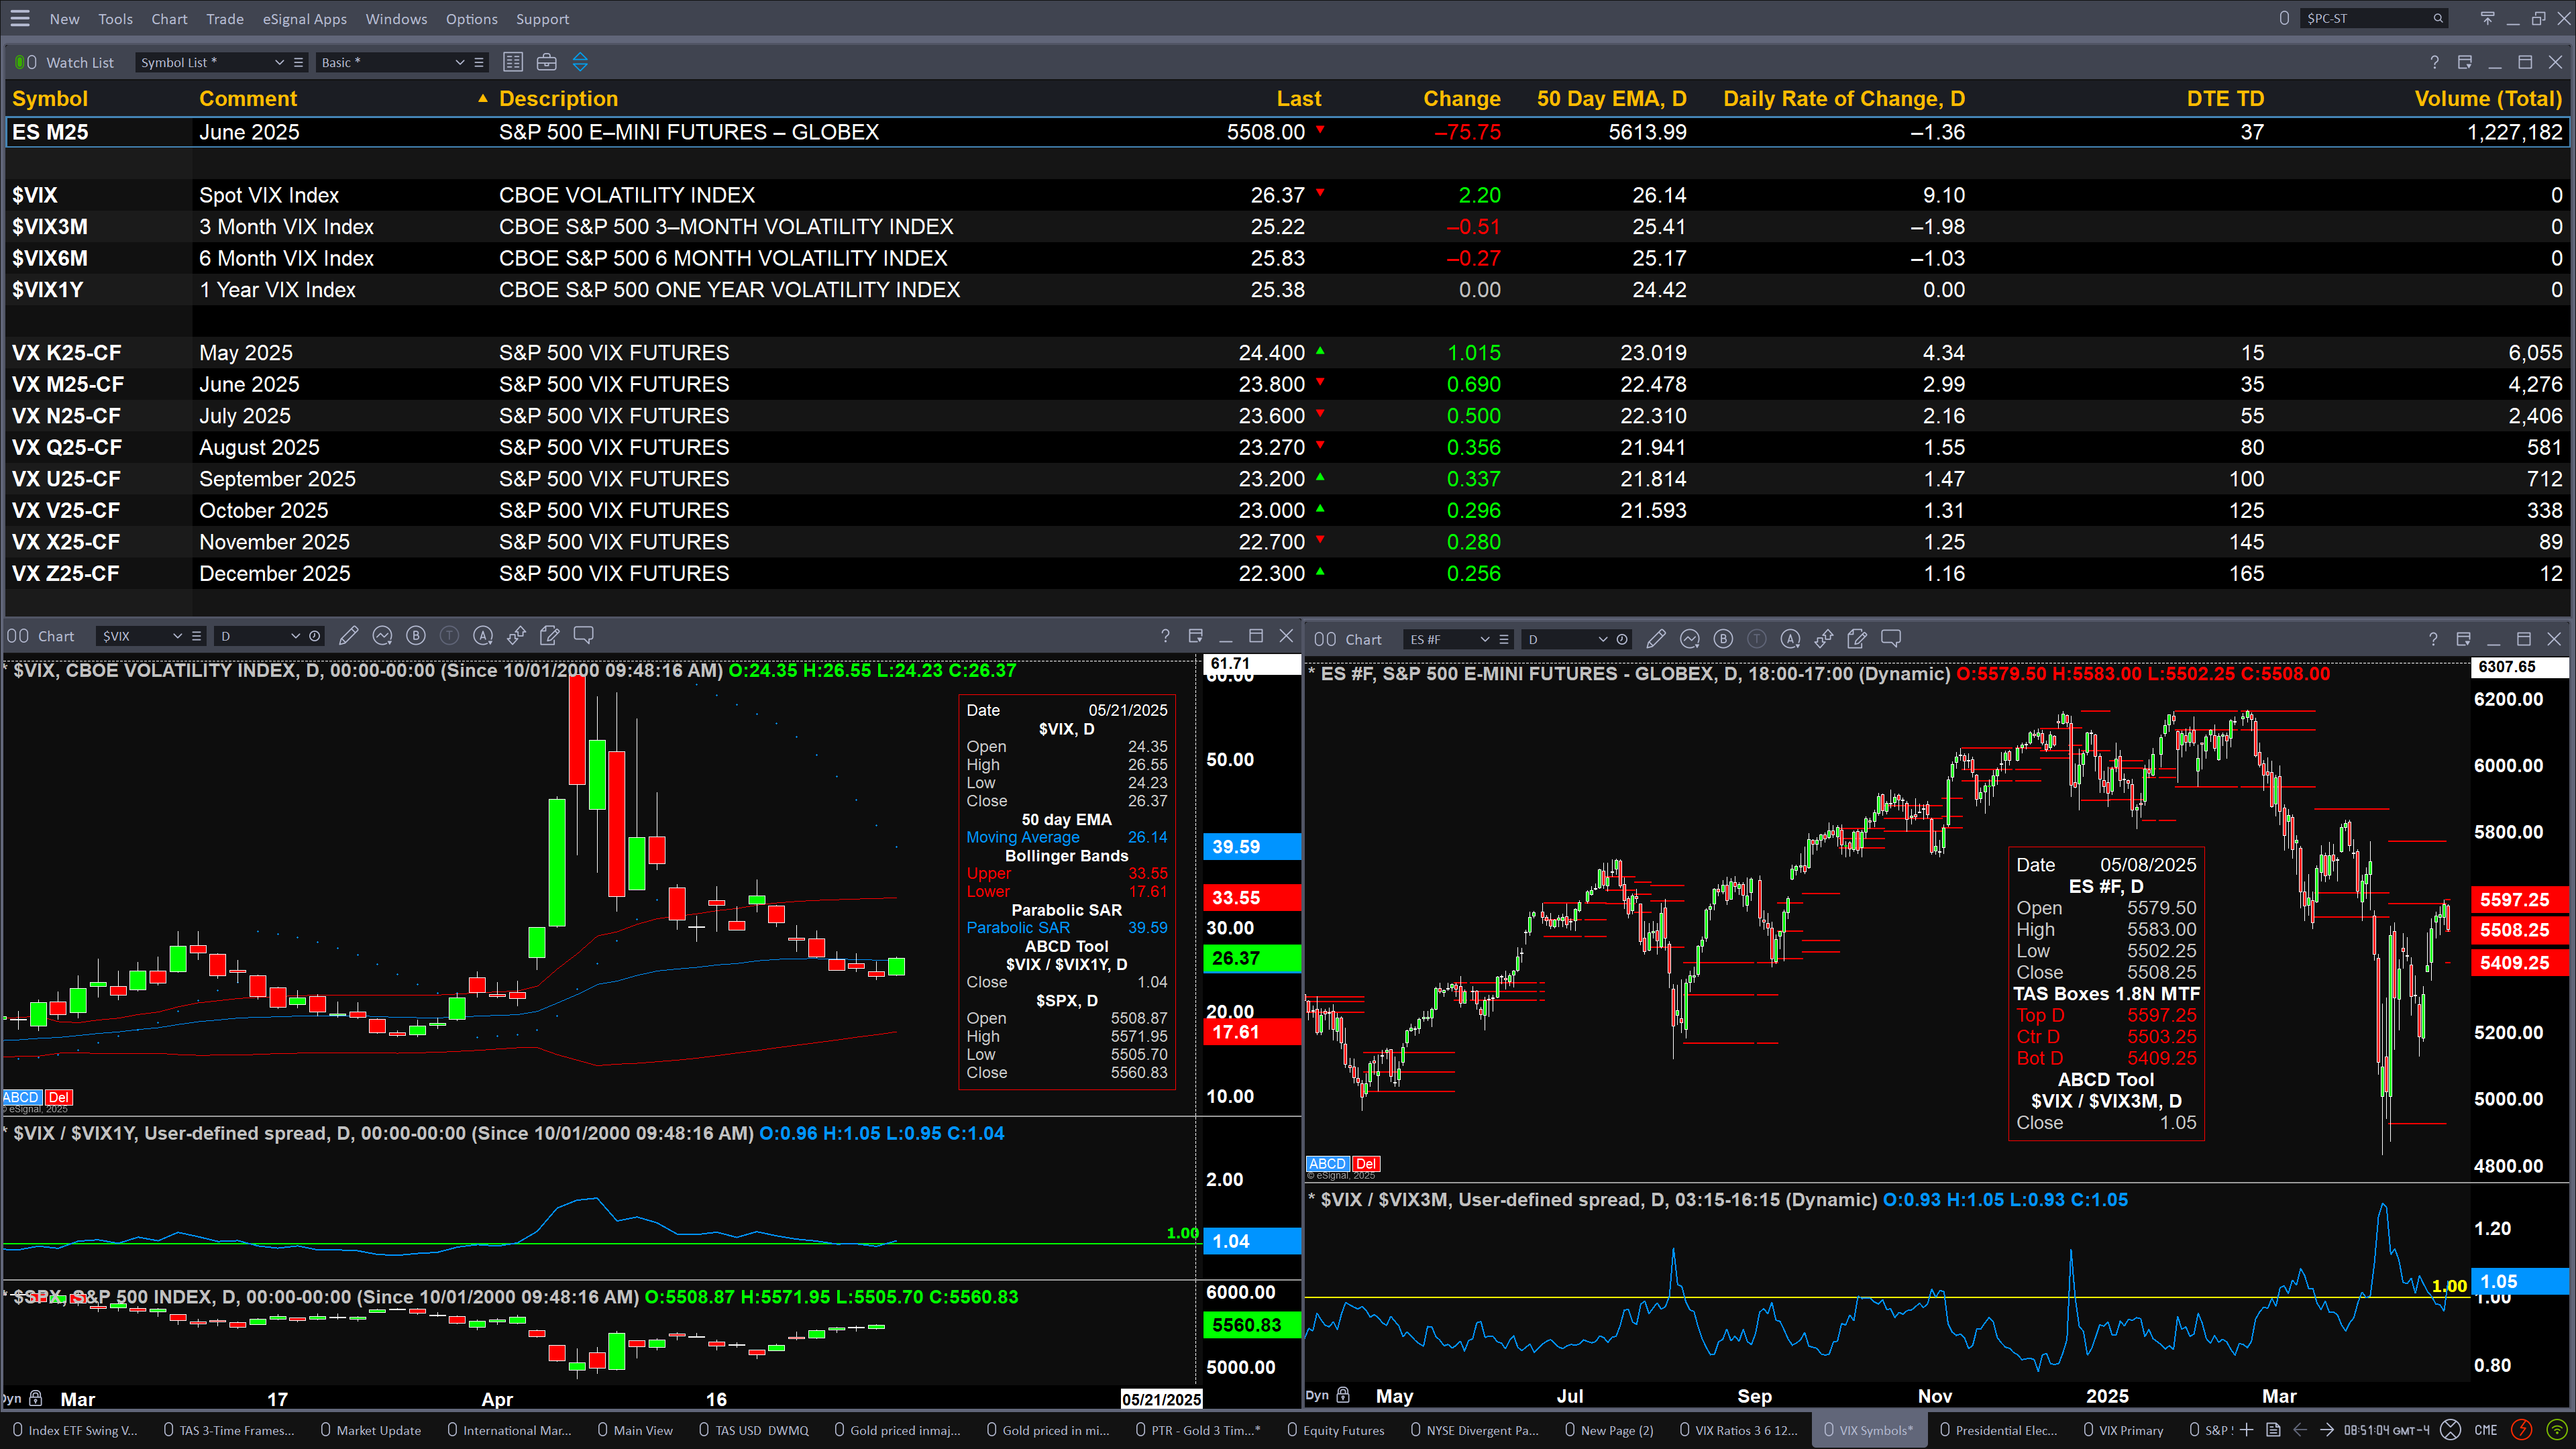
The spot VIX index is testing its 50-day EMA and a close above 26.14 would suggest that sellers would have an edge.
In the commodity space as of 8:41 a.m.:

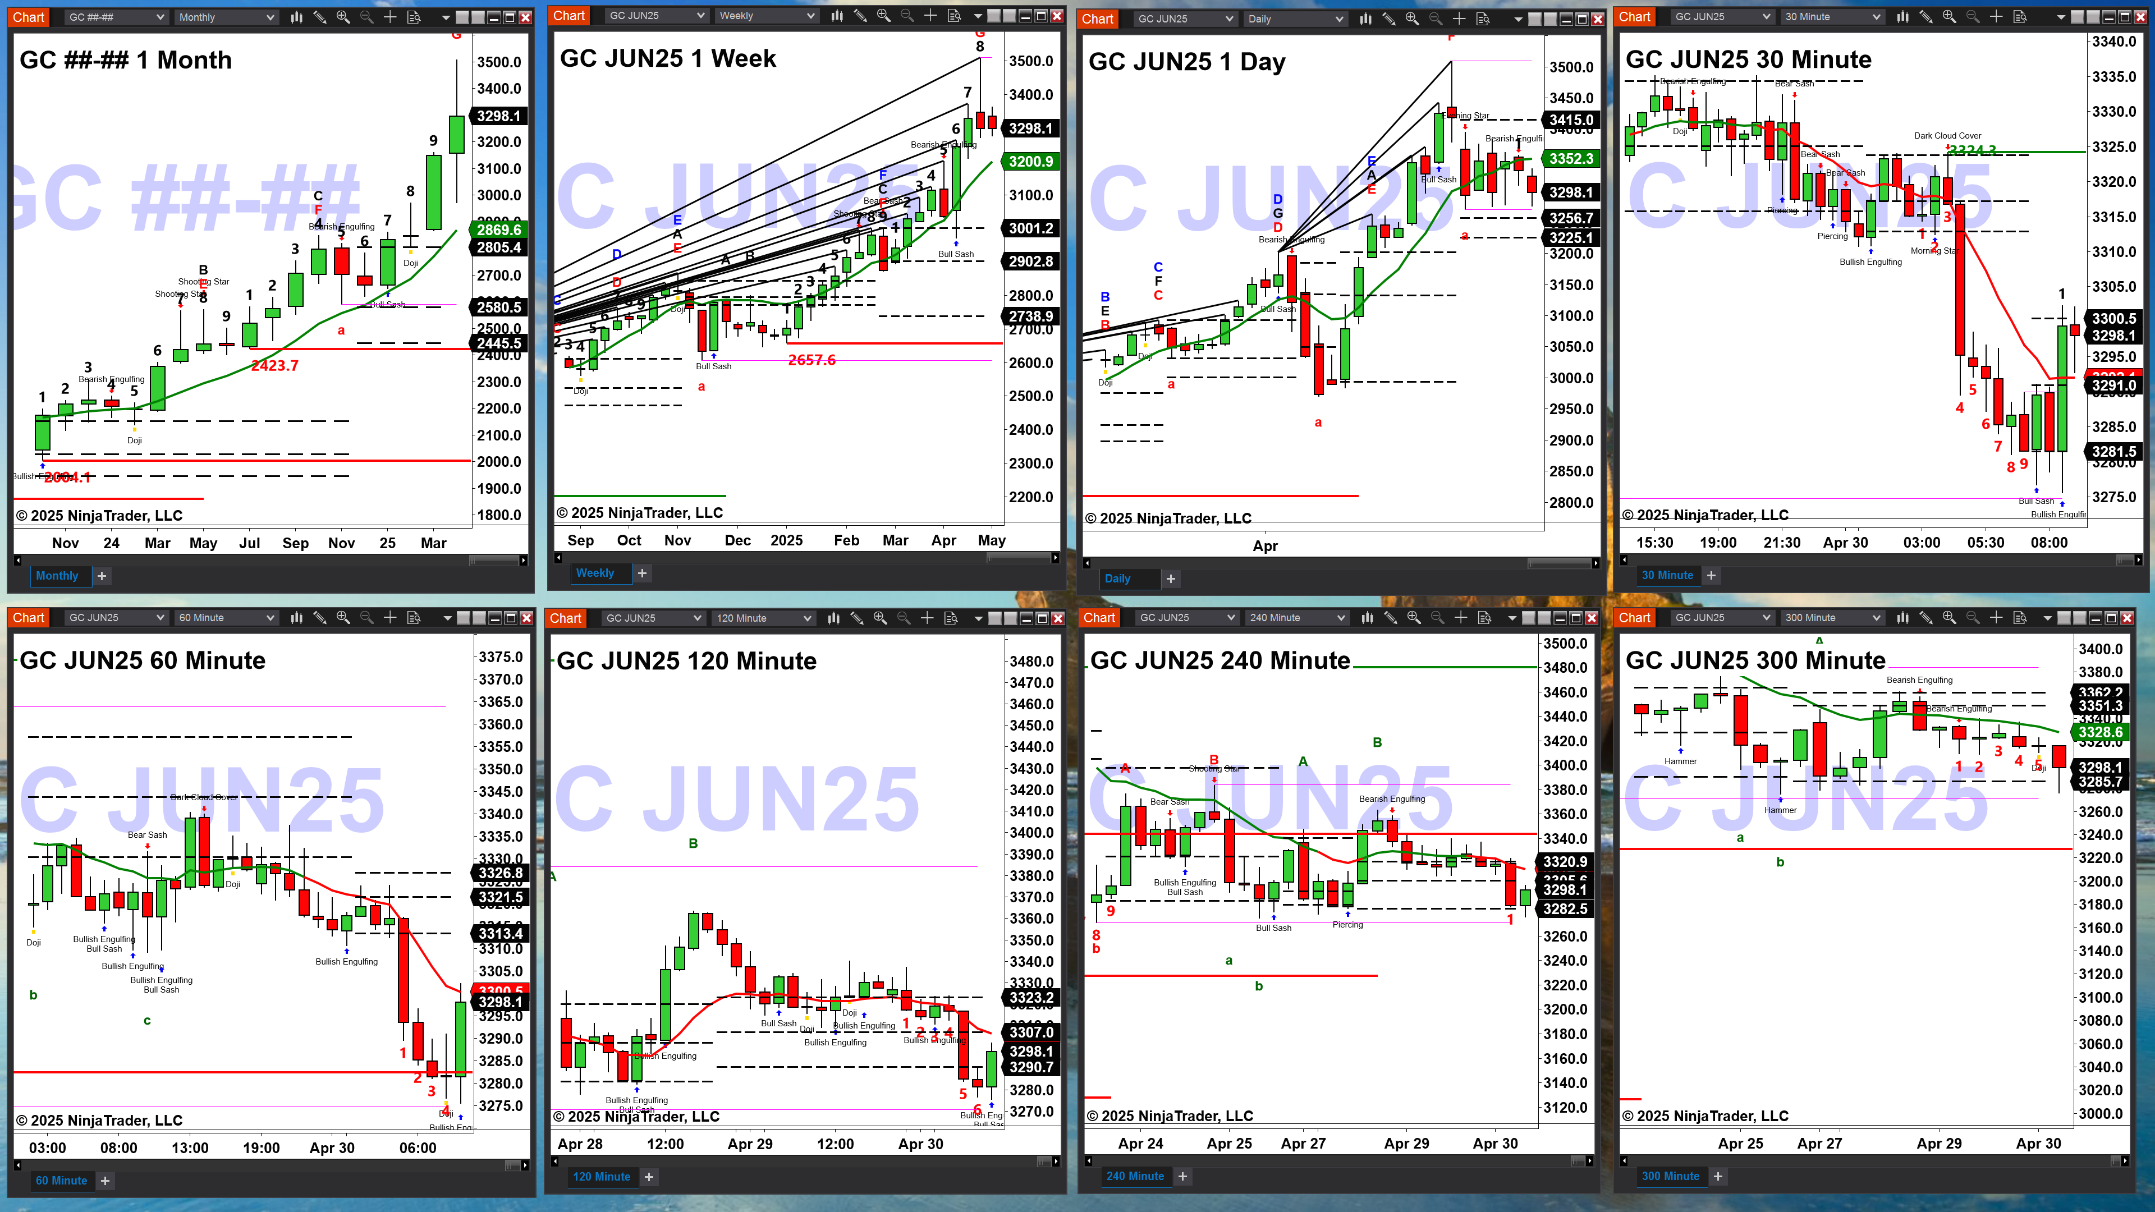
As of 8:41 a.m., the Gold charts show that:
The monthly chart will complete a TD9 top tomorrow.
The weekly chart needs a bearish reversal candle to generate a RMI top. A TD9 top should form this week and complete next week.
The daily Gold chart has a RMI top with price trading within its bullish structured profile that has support in the 3225.10 – 3256.70 zone with resistance at 3415.
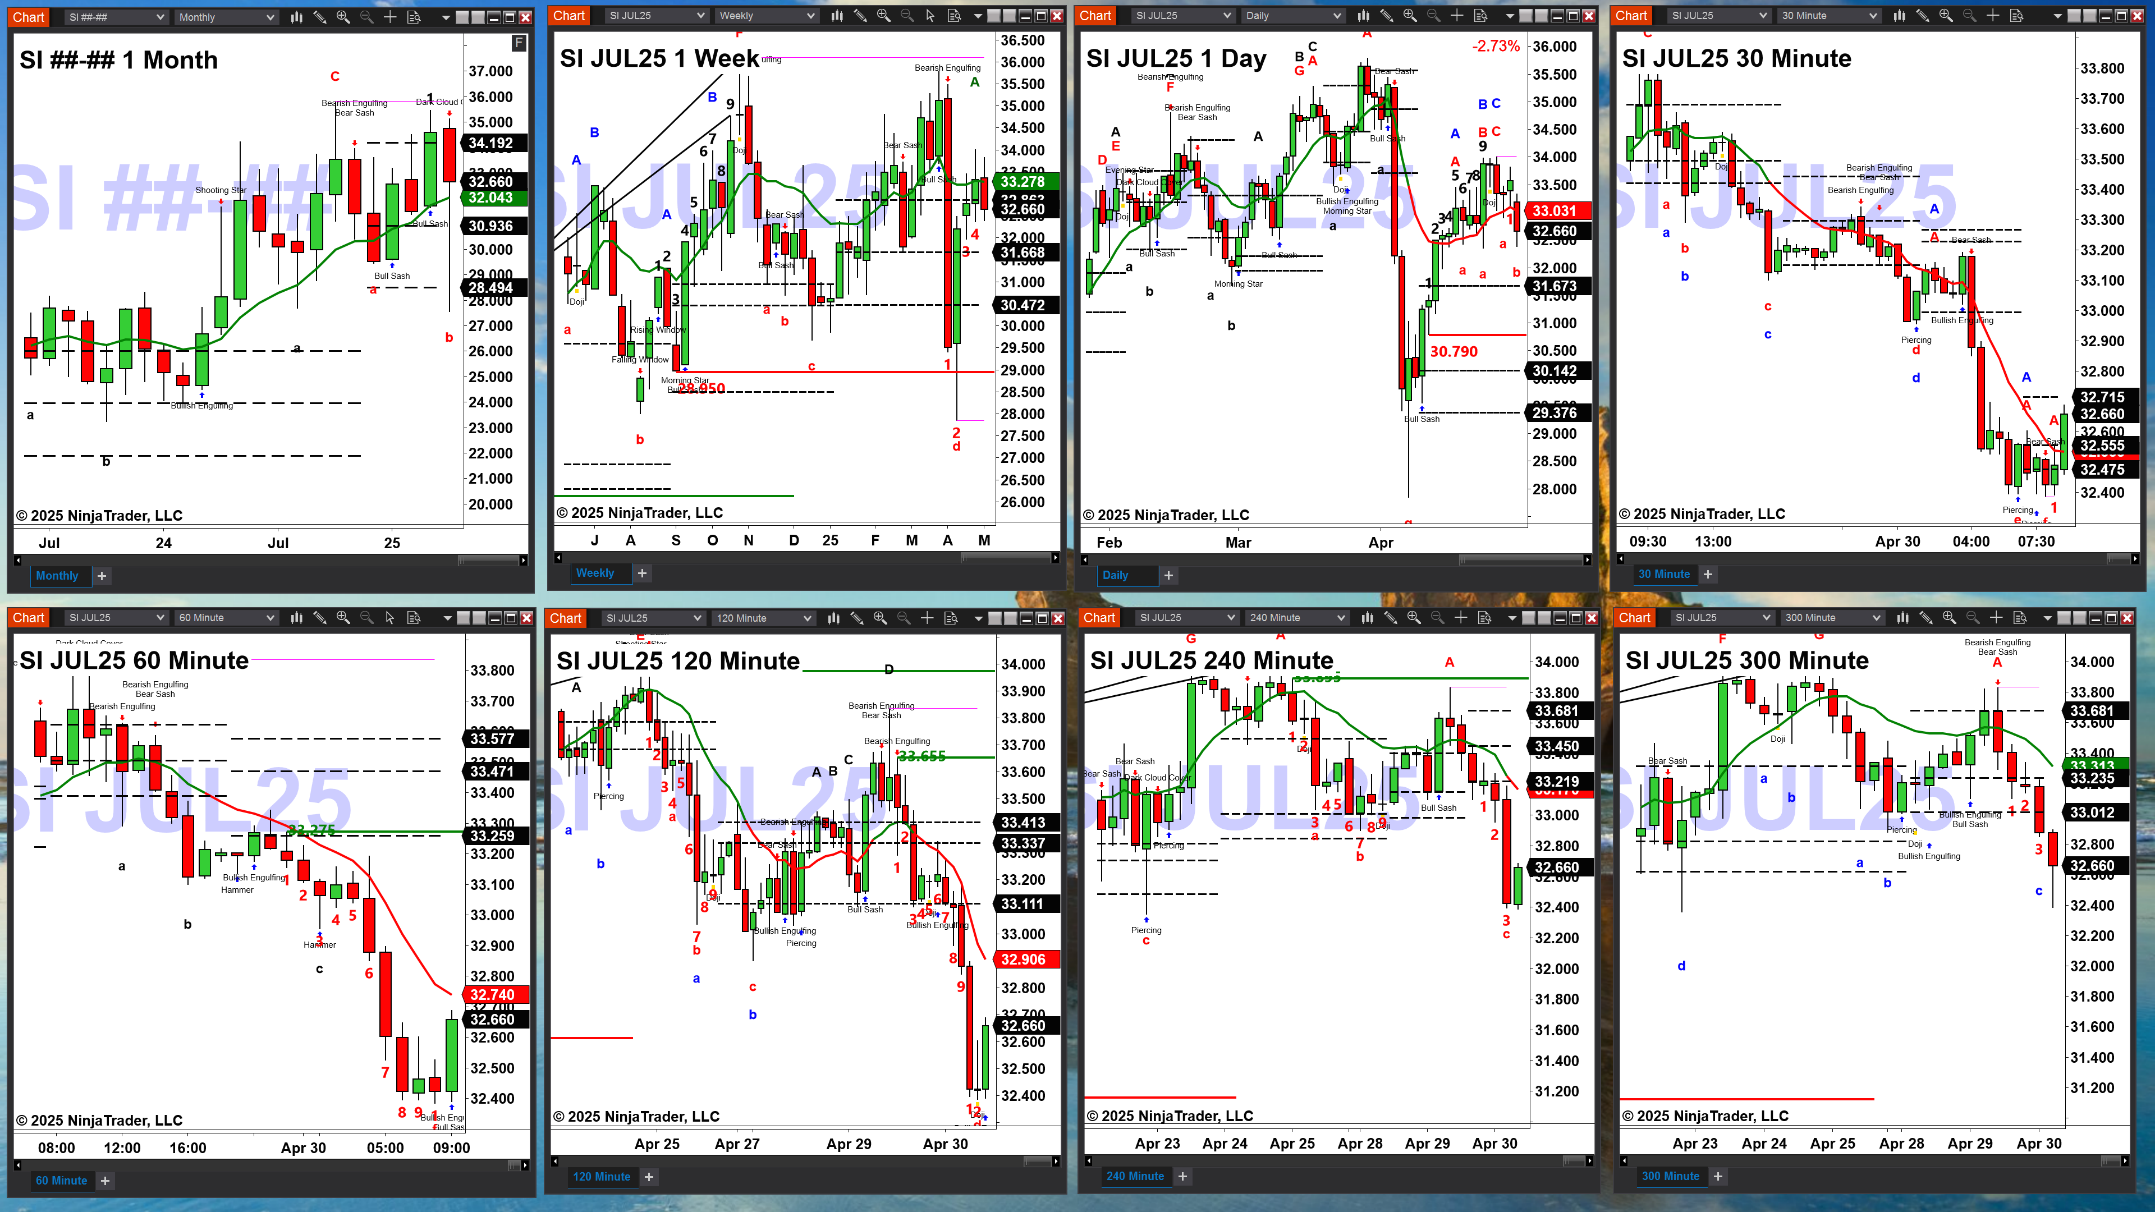
As of 8:42 a.m., Silver charts show:
The monthly chart shows that price is trading within its profile that has support at 28.49 and resistance at 34.19.
The weekly chart shows that price is trading above OUL resistance which increases the odds of a further rally.
The daily Silver chart has a TD9 top with price trading below its red OUL and that suggests a run for profile support at 31.67.
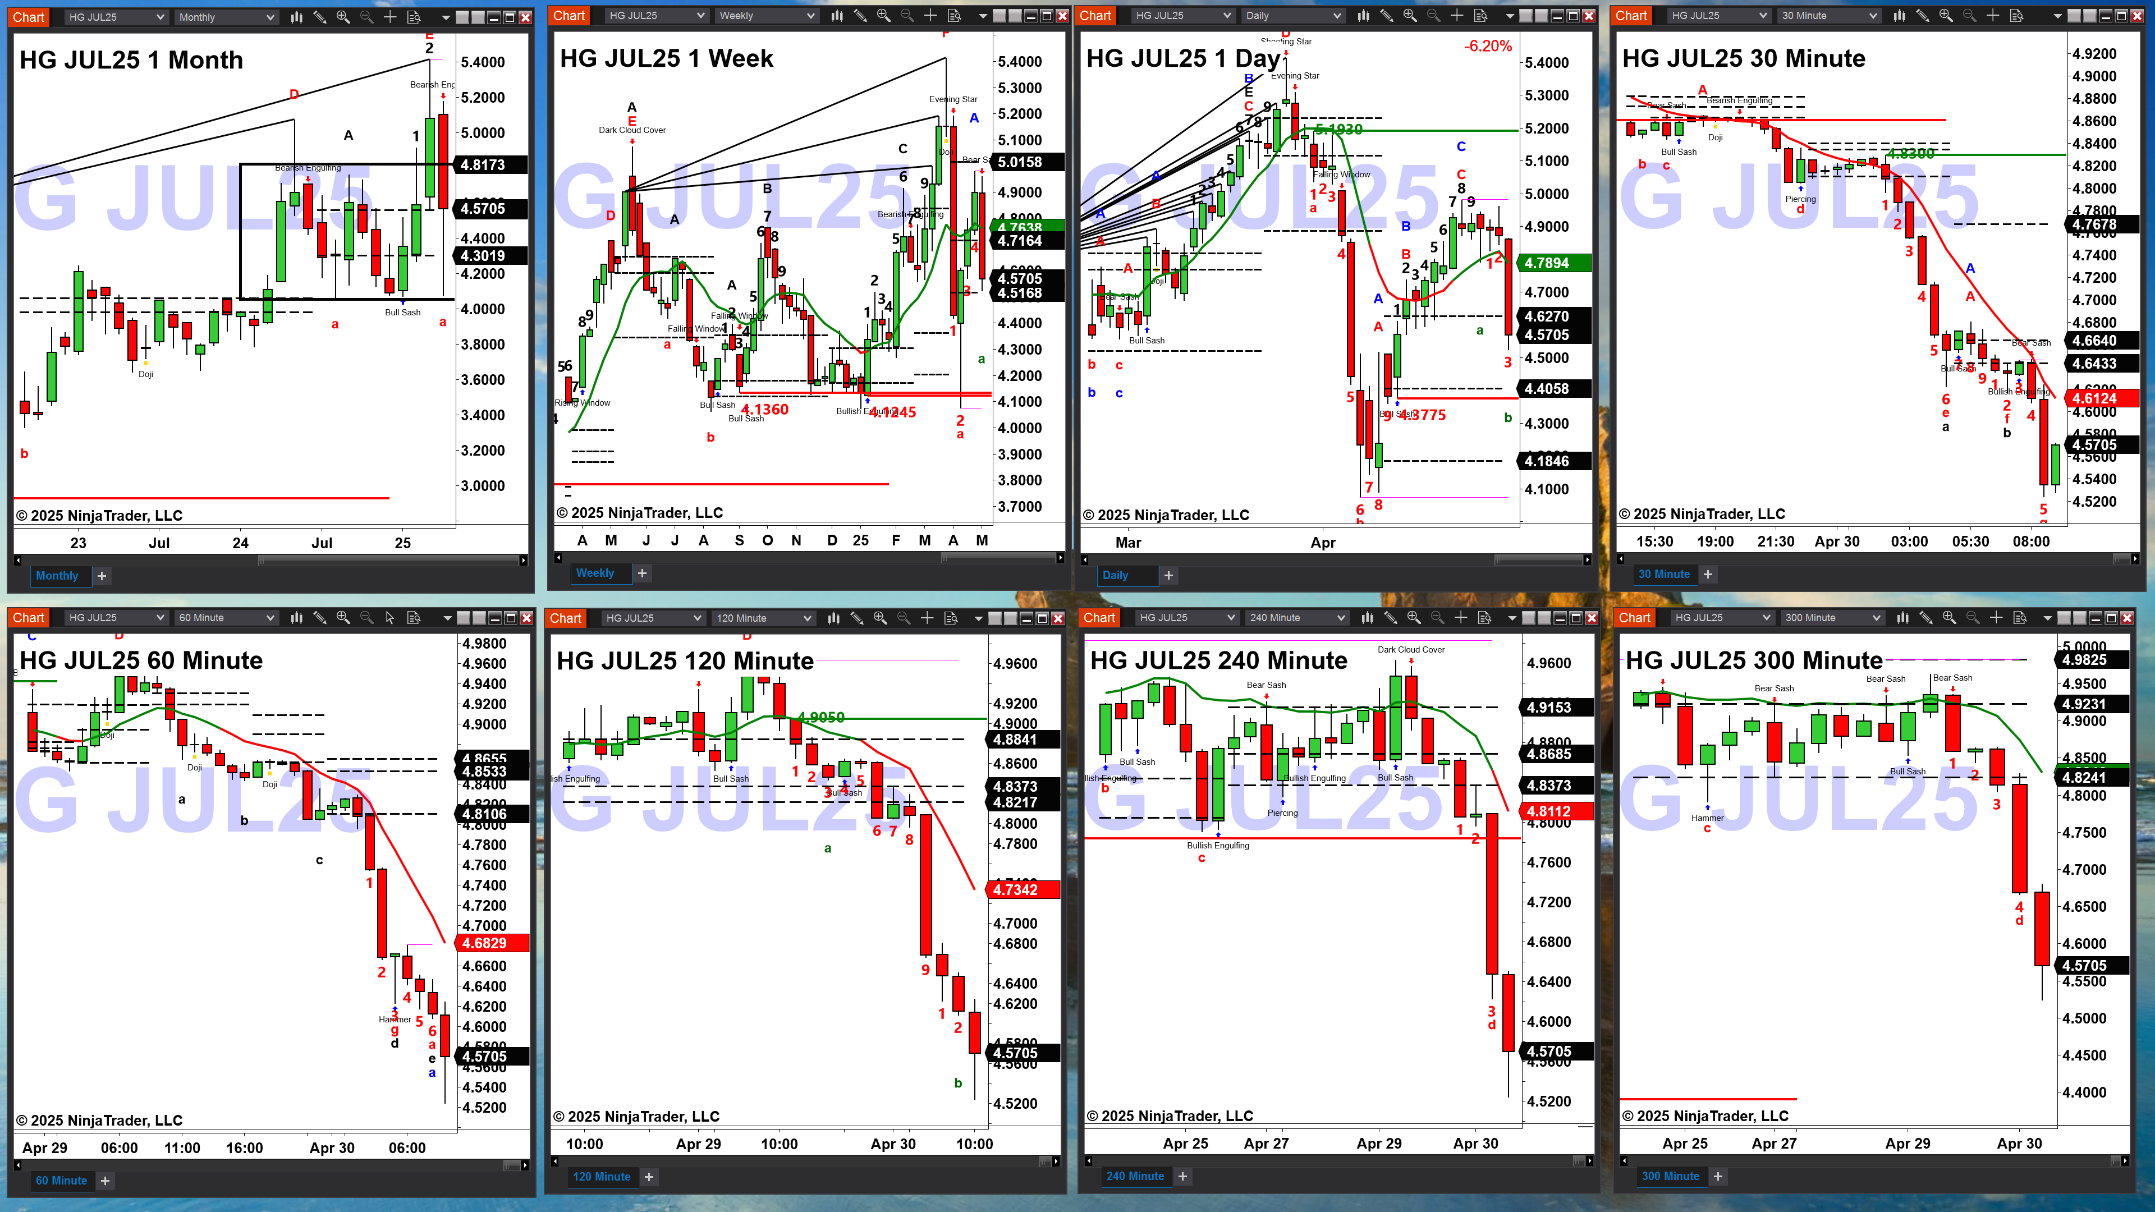
As of 8:43 a.m., Copper charts show:
The monthly chart shows that price found support at the bottom of its profile, 4.0443.
The weekly chart has a RMI top with price trading within its profile that has support at 4.5168 and resistance at 5.0158.
The daily Copper chart has a TD9 top with price trading back inside its profile and may be targeting its breakout area, 4.3775.
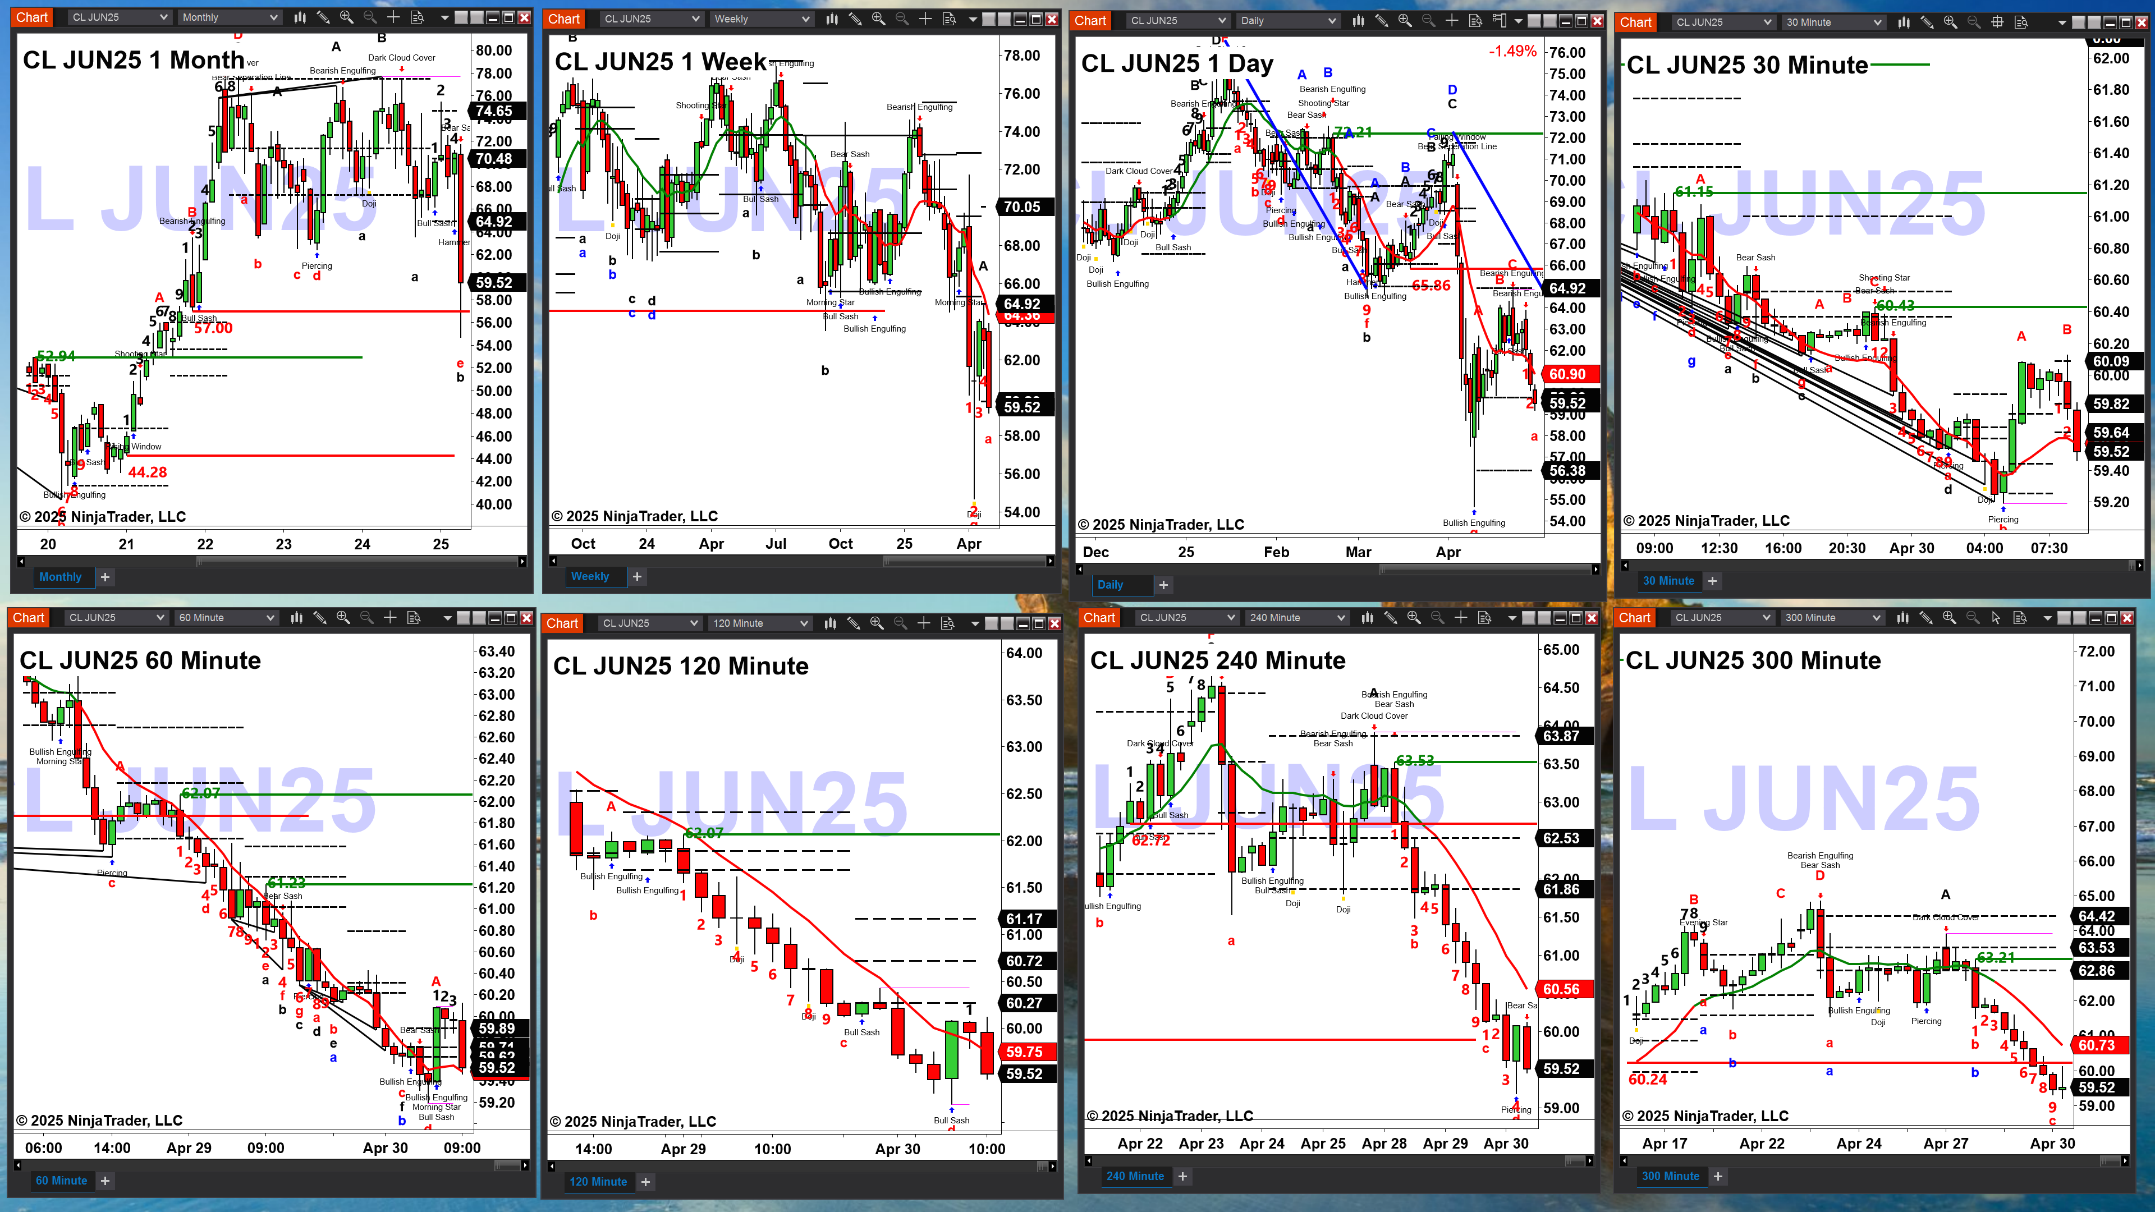
As of 8:46 a.m., the charts for Light Sweet Crude show:
The monthly chart shows that price found support at its TD9 breakout level, 57.00.
The weekly chart needs a bullish reversal candle to generate a buy the D point bottom. A new profile has formed with support at 59.80 and resistance at 70.05.
The daily Crude Oil chart has a buy the D point bottom with price trading below its red OUL and may be signaling a move to the bottom of its profile, 56.38.
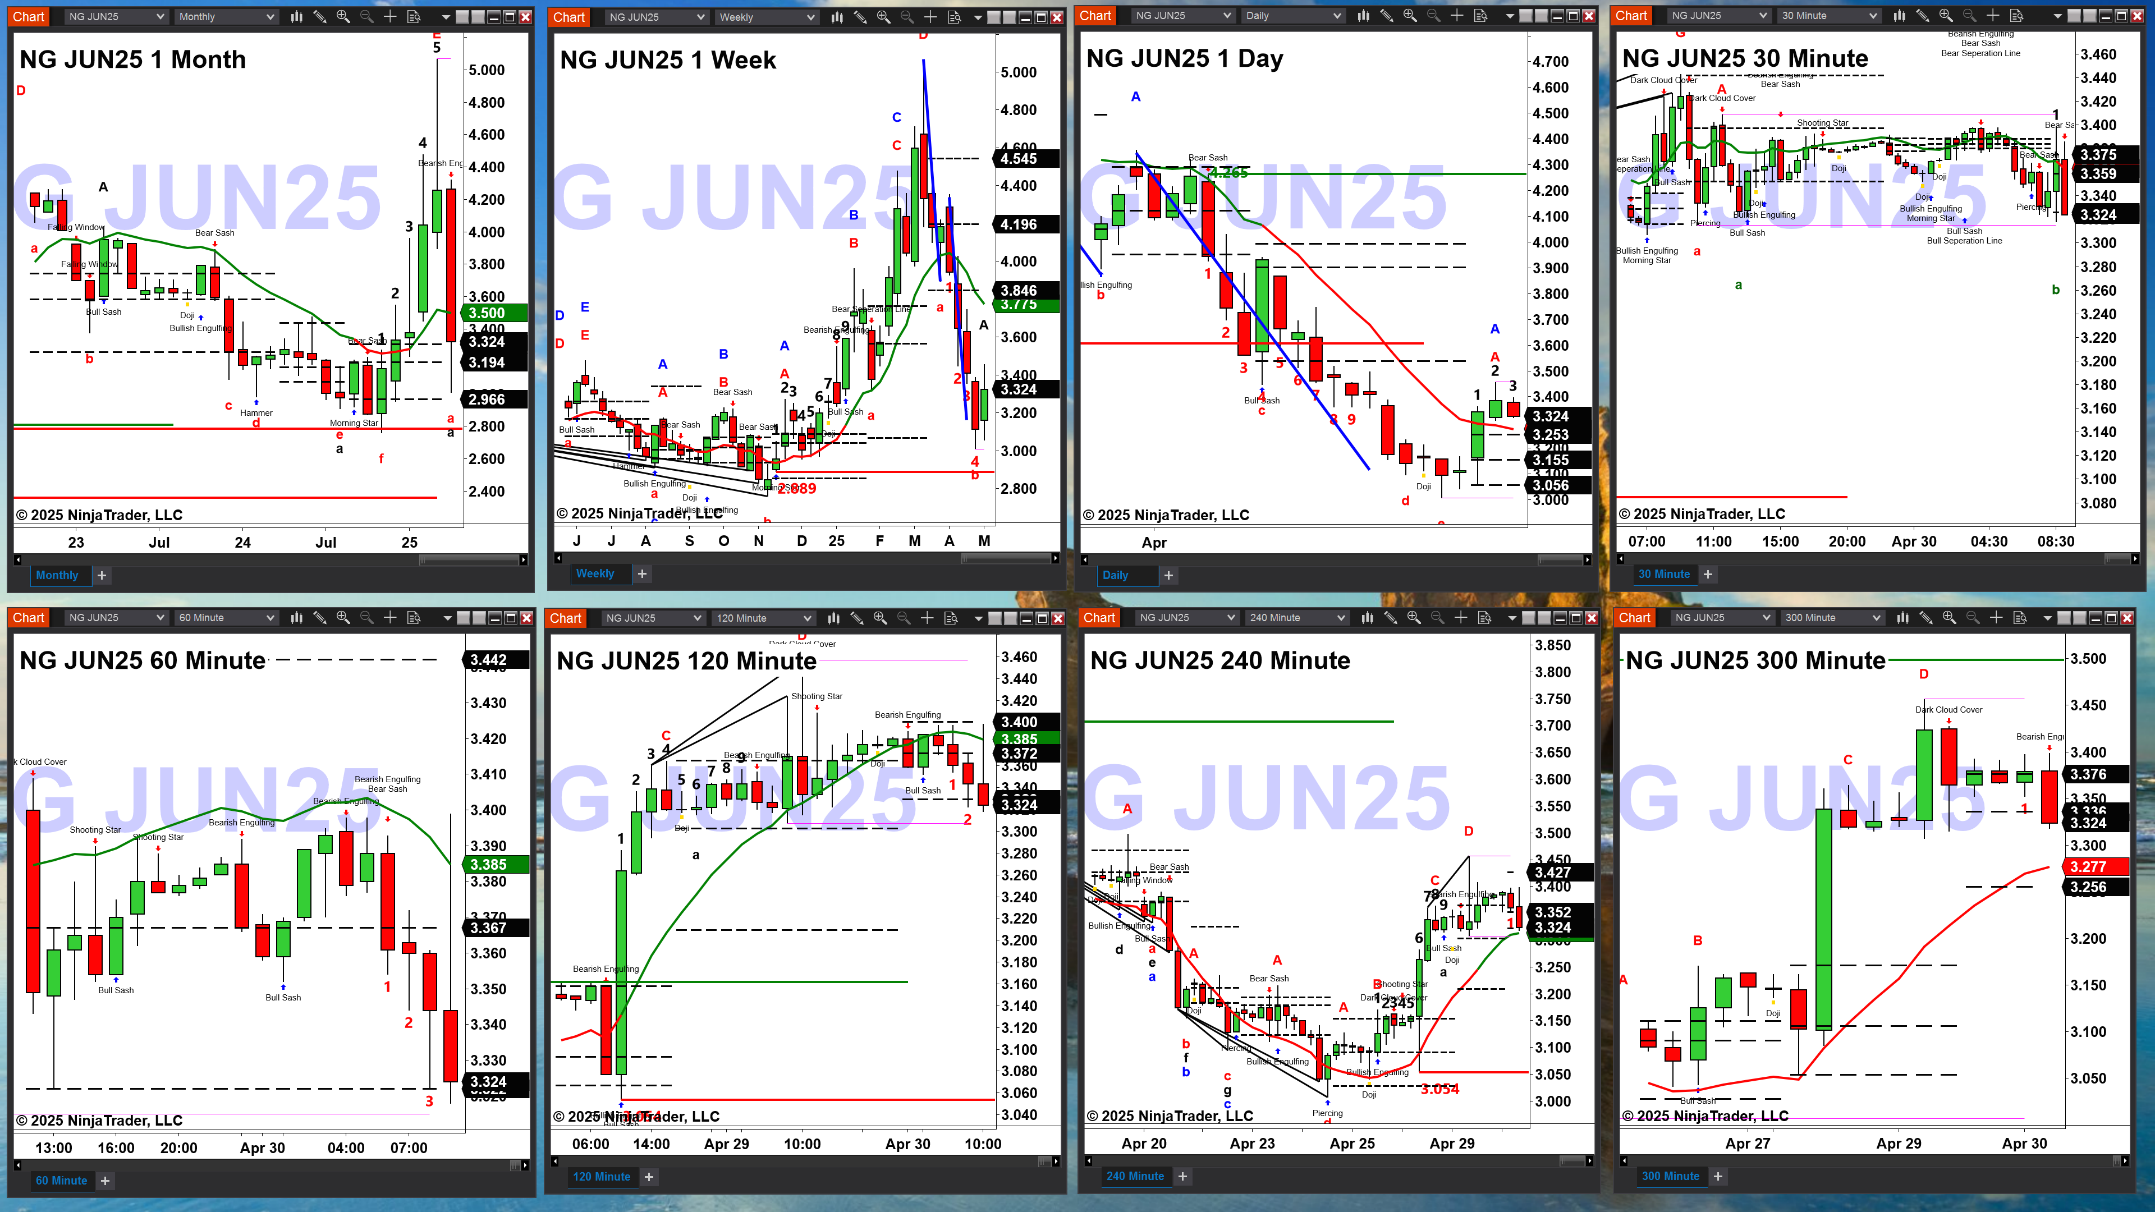
As of 8:48 a.m., the chart for Natural Gas show:
The monthly chart shows that price is trading above profile resistance.
The weekly chart has formed an ABCD down pattern that needs a bullish reversal candle to generate a buy the D point bottom.
The daily Natural Gas chart needs a bullish reversal candle to generate a buy the D point bottom. Price remains above its red OUL and top of its new profile which suggests a run for its TD9 breakdown area, 4.265.

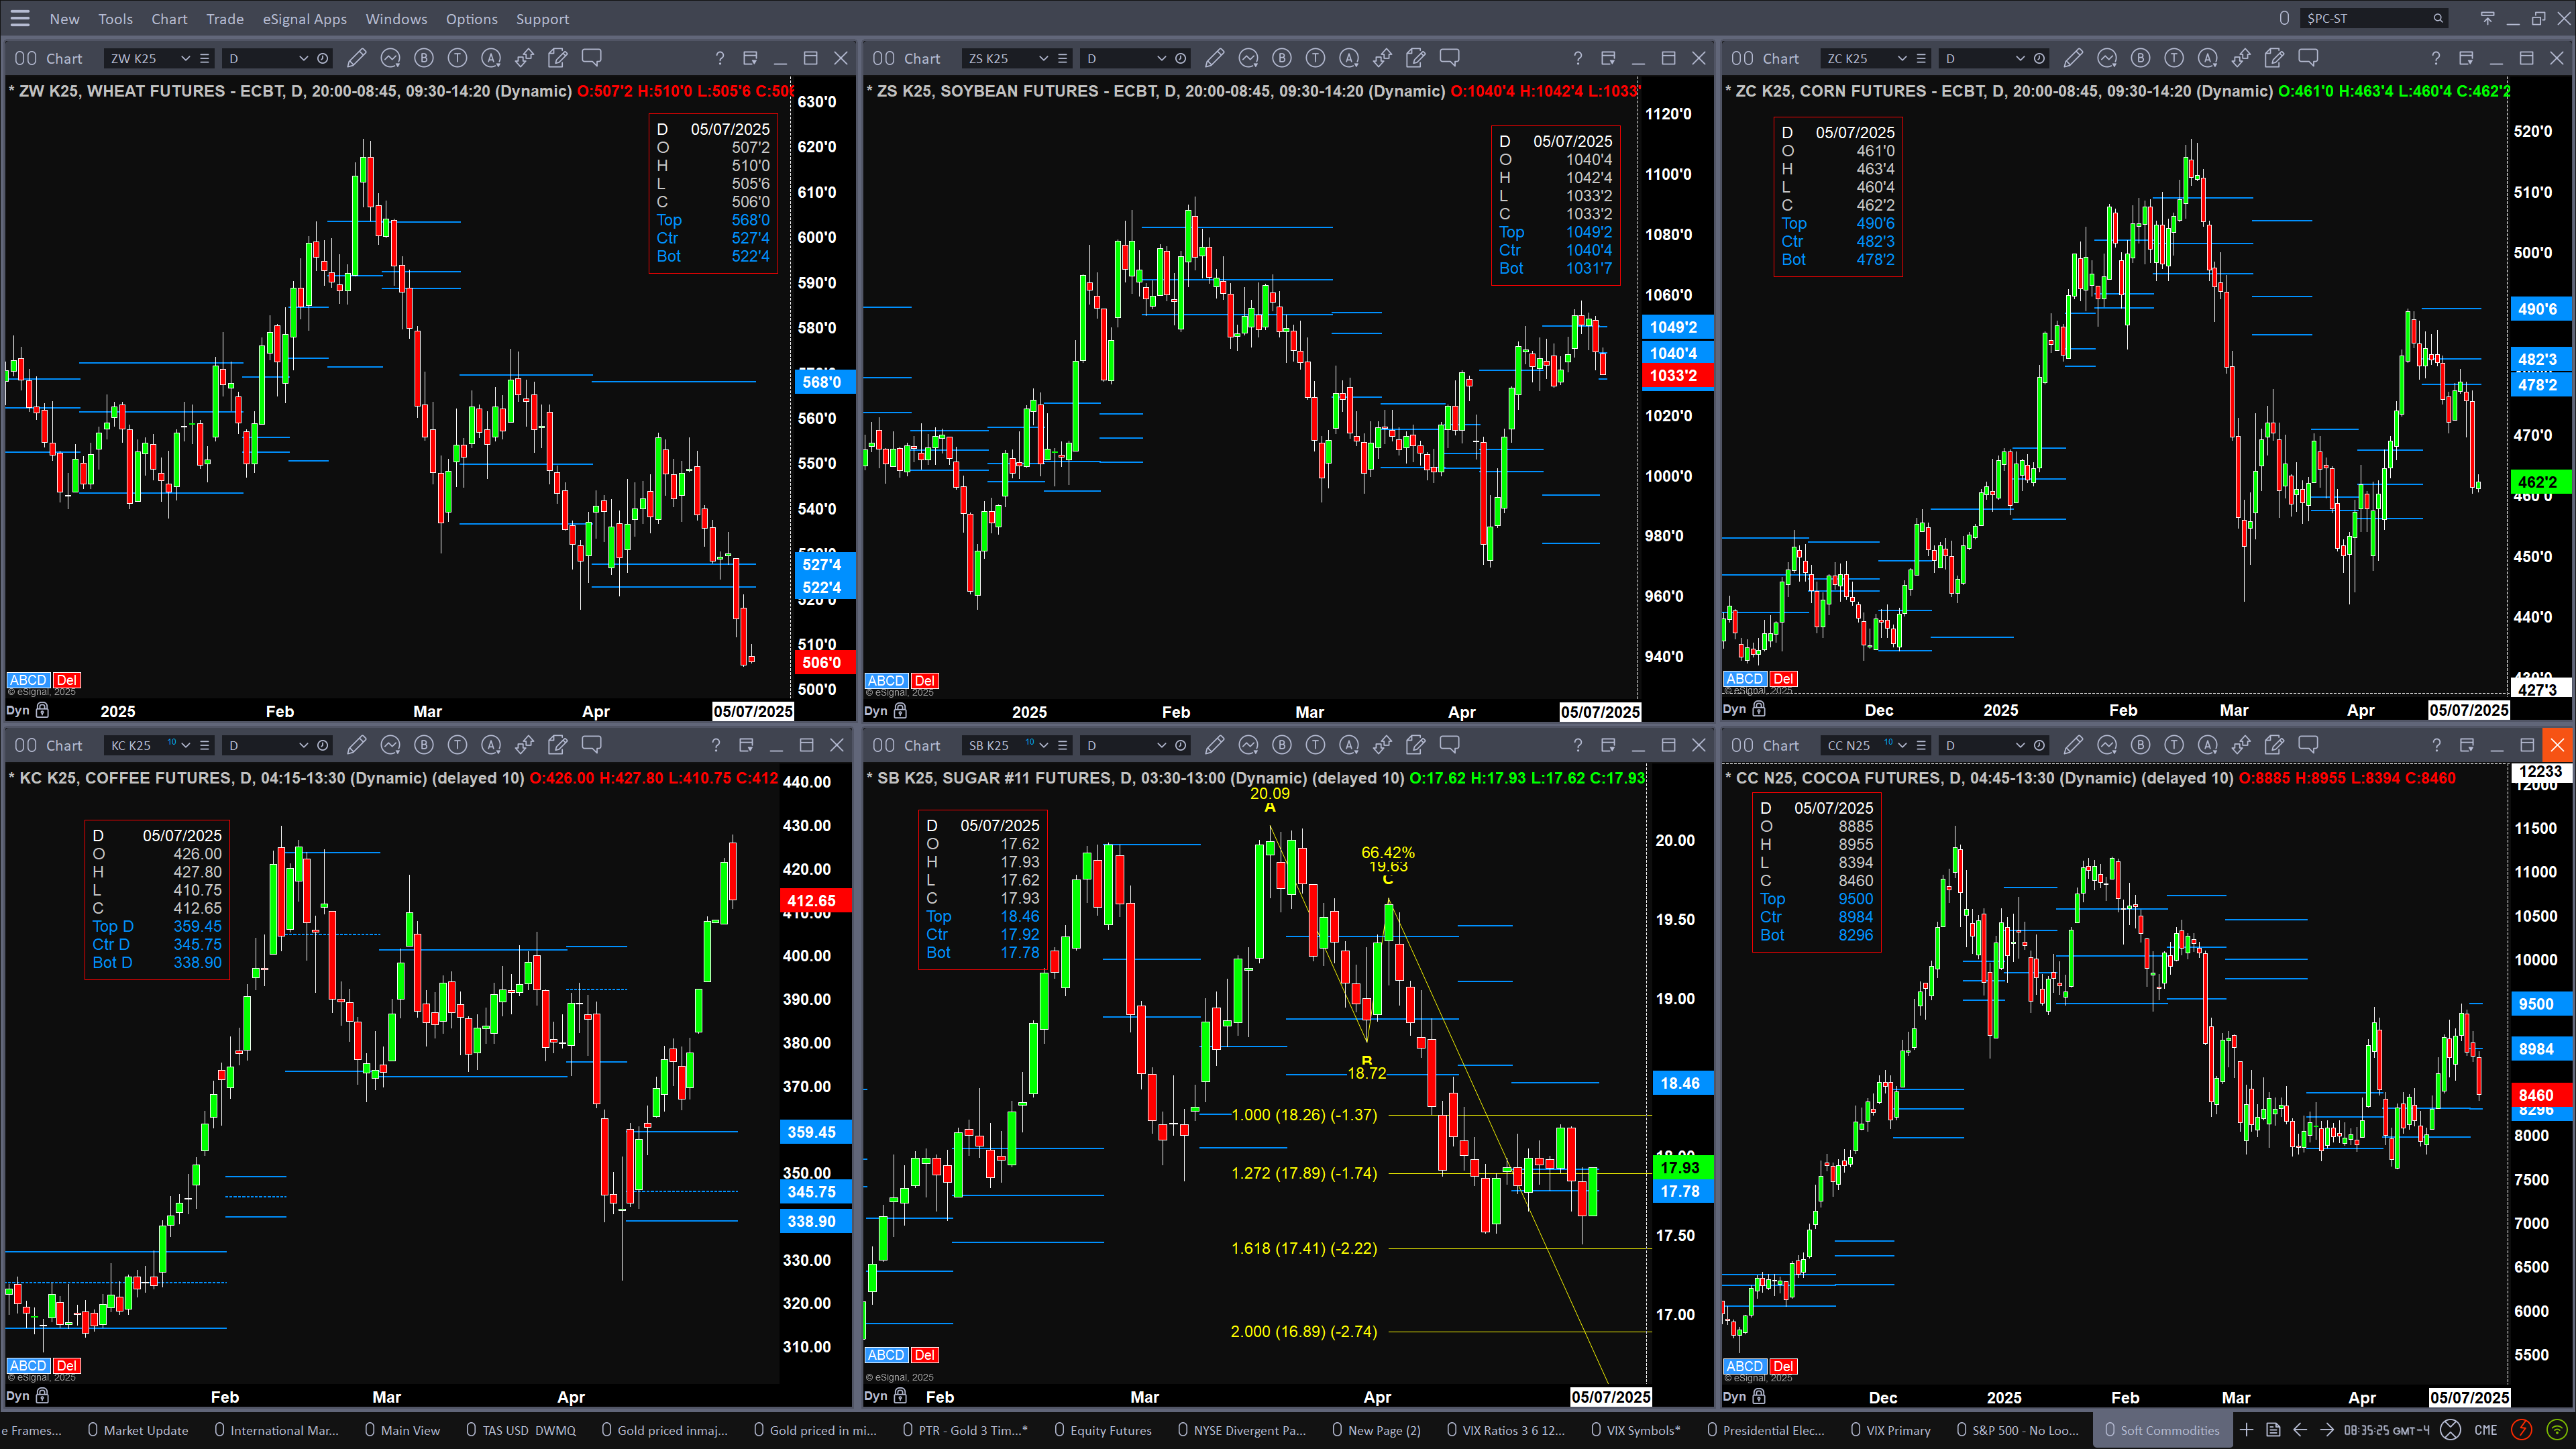
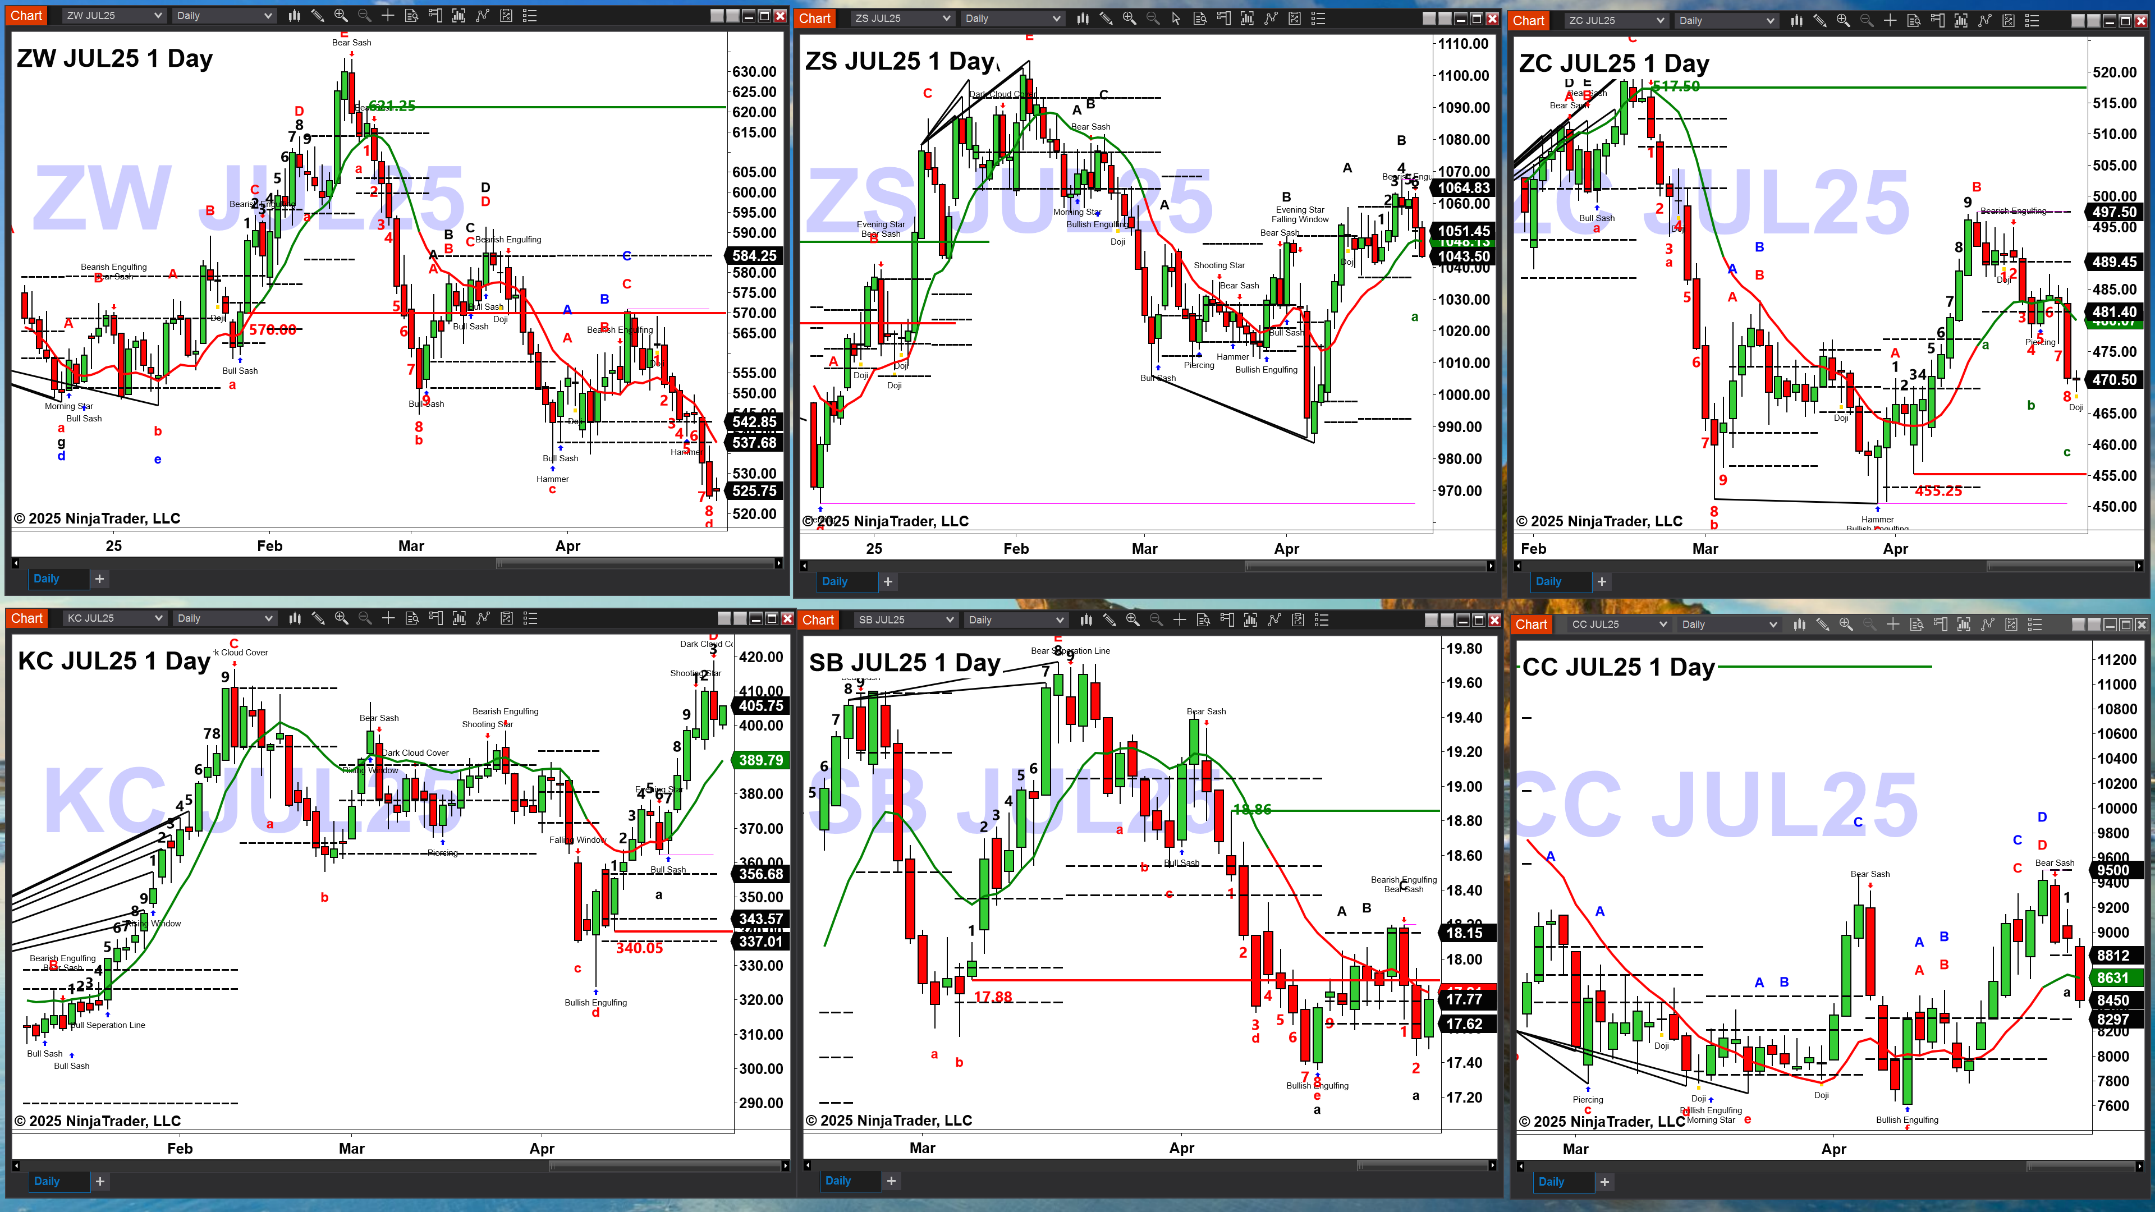
As of 8:35 a.m., soft commodity charts show that:
Wheat should form a TD9 bottom pattern today and will complete this pattern tomorrow.
Soybeans are trading within its new profile that has support at 1031’70 and resistance at 1049’20.
Corn should form a TD9 bottom pattern today and will complete this pattern tomorrow.
Coffee has a TD9 top that will be negated with a close above 410.50.
Sugar has a TD9 bottom with price trading within its profile.
Cocoa has a RMI bottom with price trading within its new profile that has support at 8297 and resistance at 9500.
Treasury bonds and notes are trading lower as of 8:38 a.m.

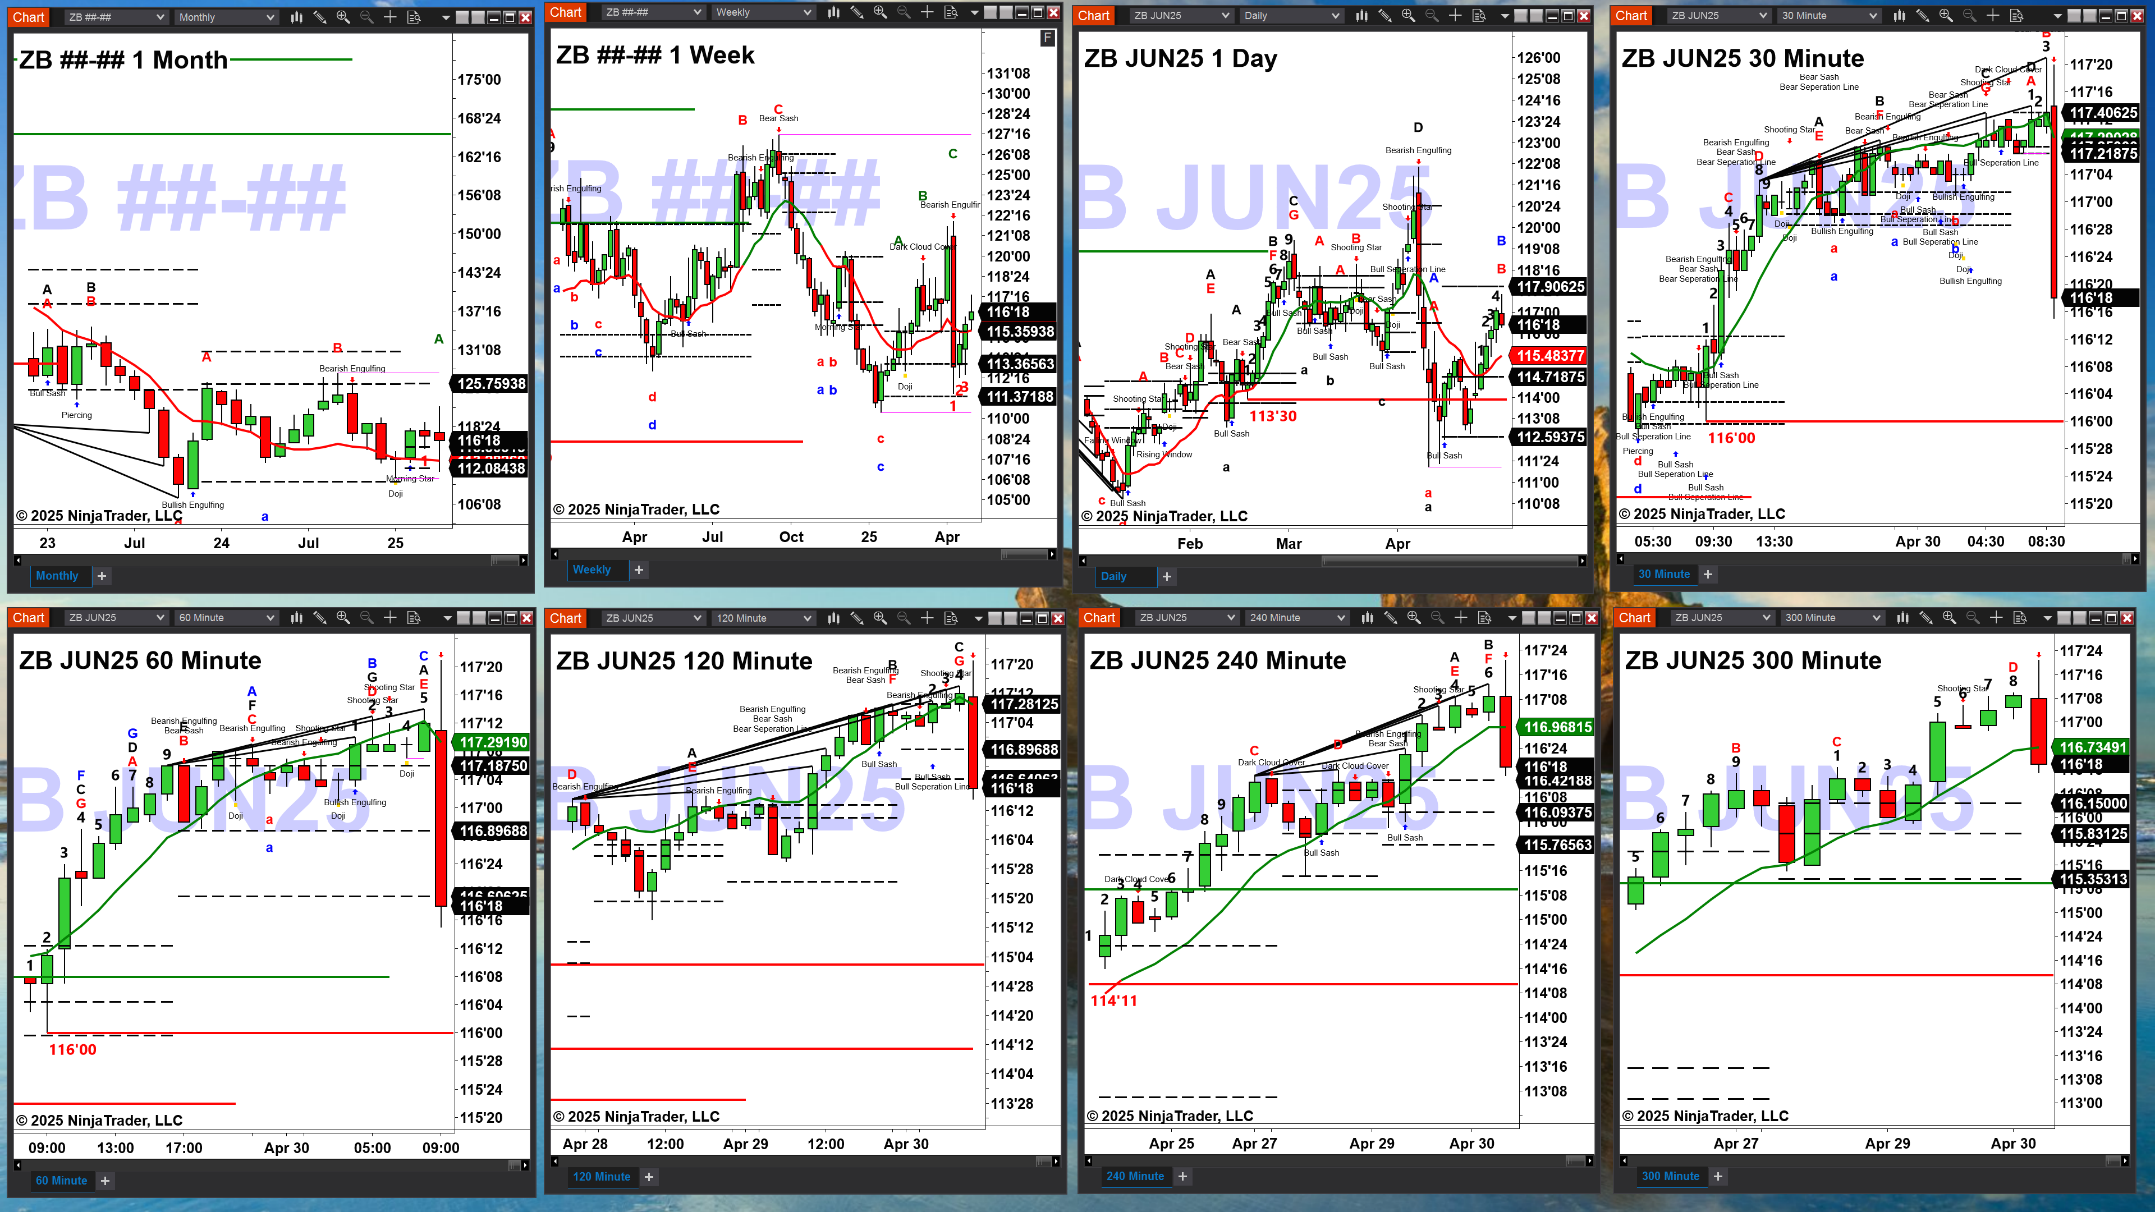
As of 8:38 a.m., the charts for the 30-year Treasury Bond show:
The monthly chart shows that price is trading within its profile that has support at 110’05 and resistance at 125’27.
The weekly chart shows that price is trading above profile resistance which increases the odds of a further rally.
The daily chart for T-bonds is trading within its profile that has support at 112’15 and resistance at 117’31.
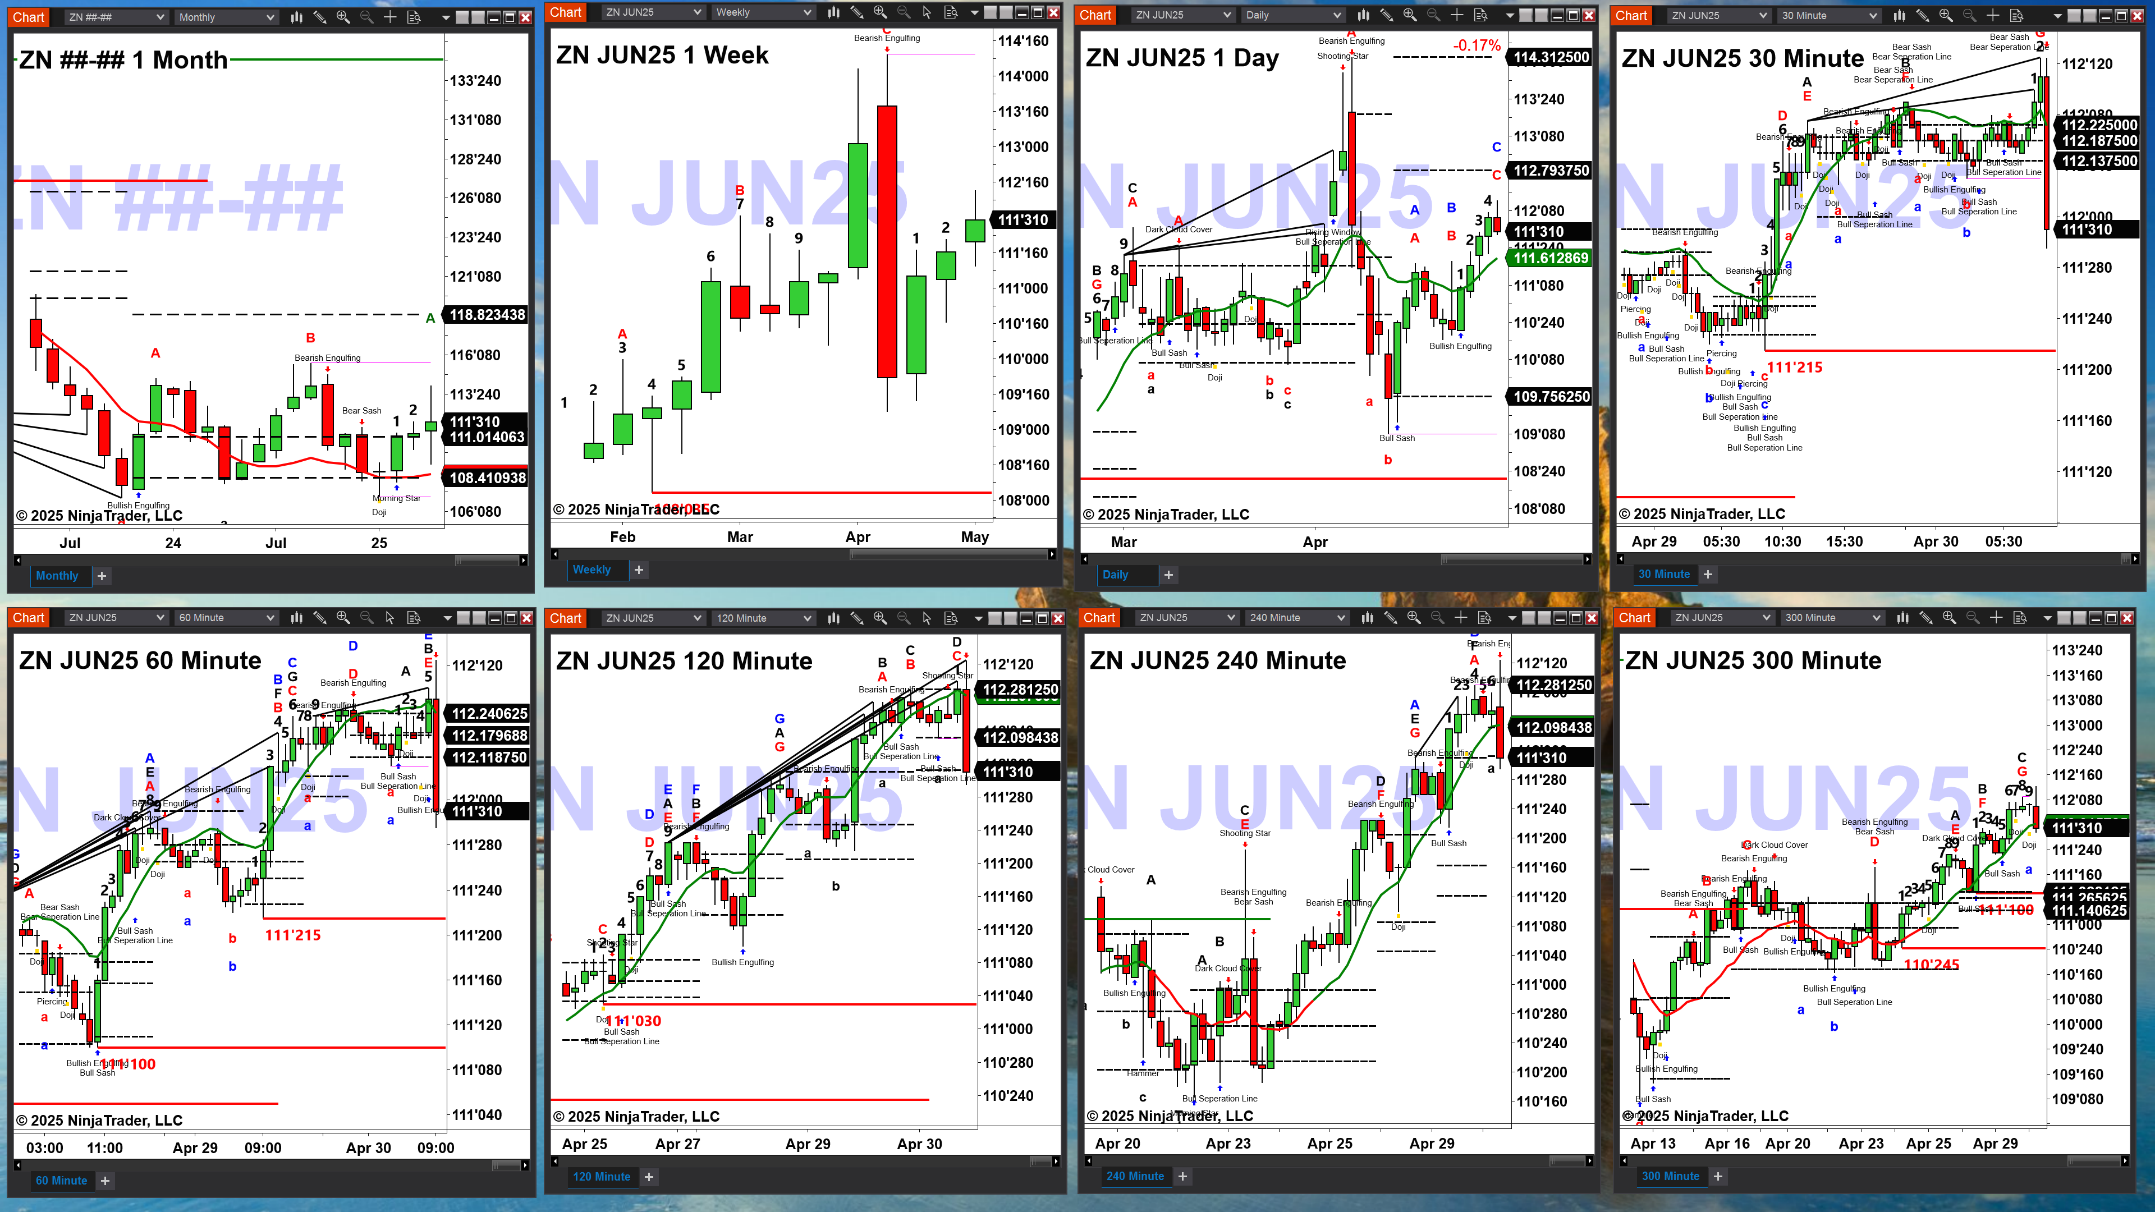
As of 8:39 a.m., the charts for the 10-year Treasury Note show:
The monthly chart shows a RMI bottom with price trading within its profile that has support at 108’10 and resistance at 118’26.
The weekly chart is showing a pattern of higher lows.
The daily chart for T-Notes shows that price is trading within its profile that has support at 109’24 and resistance at 114’10.
Terminology used throughout the newsletter and what it means: Note: you have access to workshops on your members page that also review in detail the terminology used within the newsletter.
Chart legend : The red/green line is the Oscillator Unchanged Line. A green line means that the Price Oscillator (the difference between the 19 & 39 day EMA) is above zero and when the line is red, it means that the Price Oscillator is below zero. When price is above a green OUL, it is a bullish condition and when price is below a red OUL, it is a bearish condition. When price is below a green OUL, it suggests a retracement back to support and when price is above a red OUL, it suggests a countertrend rally to resistance.
Black number are TD9 Setup counts. A 9 count indicates an impending trend change may be near. The red and green lines are the TD9 breakout support (red) and breakdown resistance (green) levels that define important trend reversal price levels.
Black diagonal lines on a chart represent Rhodes Momentum Indicator signals. When these lines are present at a bottom, it tells us that price has taken out a prior low with less relative weakness and therefore, a bullish reversal candle is what we use to identify a bottom. RMI signals that are present at a top let us know that price is moving higher with less relative strength and a bearish reversal candle would confirm a top.
TAS Market Profiles are represented by the black dash line. The top of a profile is where sellers are located and the bottom of a profile is where buyers are located. The center line, is the price point that both buyers and sellers believe is fair value within the range of the top and bottom of its profile. When the center line is closer to the bottom vs. the middle of the profile, the market profile is bullish in structure whereas a center line that is closer to the top vs. the midpoint is a bearish structured profile. A bullish structured profile simply lets us know that buying should occur between the center and the bottom. The opposite is true for a bearish structured profile.
A ”buy the D point pattern forms with an AB=CD down pattern that gets confirmed with a bullish reversal candle.
A ”Sell the D point pattern forms with an AB=CD up pattern that gets confirmed with a bearish reversal candle.
Bullish and bearish reversal candles are represented by Japanese candlesticks of which we use seven specific patterns. Bullish reversal candles include the Hammer, Bullish Engulfing, Piercing, Bull Sash, Bull Separating Line, Rising Window (gap up) and the Morning Star pattern. Bearish reversal candles use the exact opposite which include the Shooting Star, Bearish Engulfing, Dark Cloud Cover, Bear Sash, Bear Separating Line, Falling Window (gap down), and Evening Star pattern formation.
Many of our pattern signals come from futures charts. The S&P 500 is represented by the ES mini. The Nasdaq 100 is represented by the NQ. The DOW equity futures chart symbol is YM and the Russell 2000 futures symbol is RTY.
Disclaimer: Trading in securities such as stocks, options, indexes, currencies, and futures involve risk and should not be undertaken without due diligence and serious independent study. Options, stocks, currencies, and futures trading, involve substantial risk. Subscribers may carry out their trading based on what they learn from “Mastering Probability” however all risks of potential financial losses are the customer’s responsibility. TFNN, Corp. and/or Steve Rhodes will be in no way liable for financial losses resulting from trading decisions based on this newsletter. Past performance is no guarantee of future results. Reproduction in whole, or in part, is not permitted without prior written consent. Copyright 2024 all rights reserved.

